Why Feed Conversion Ratio (FCR) Drives Fish and Shrimp Farm Economics
Short answer: Feed Conversion Ratio, or FCR, is the most critical metric in aquaculture because it quantifies how efficiently a farm converts feed into biomass. Since feed represents the largest portion of operating expenses for fish and shrimp farms, even minor improvements in this ratio lead to substantial increases in profit margins. This article is a planning guide only, not engineering or financial advice.
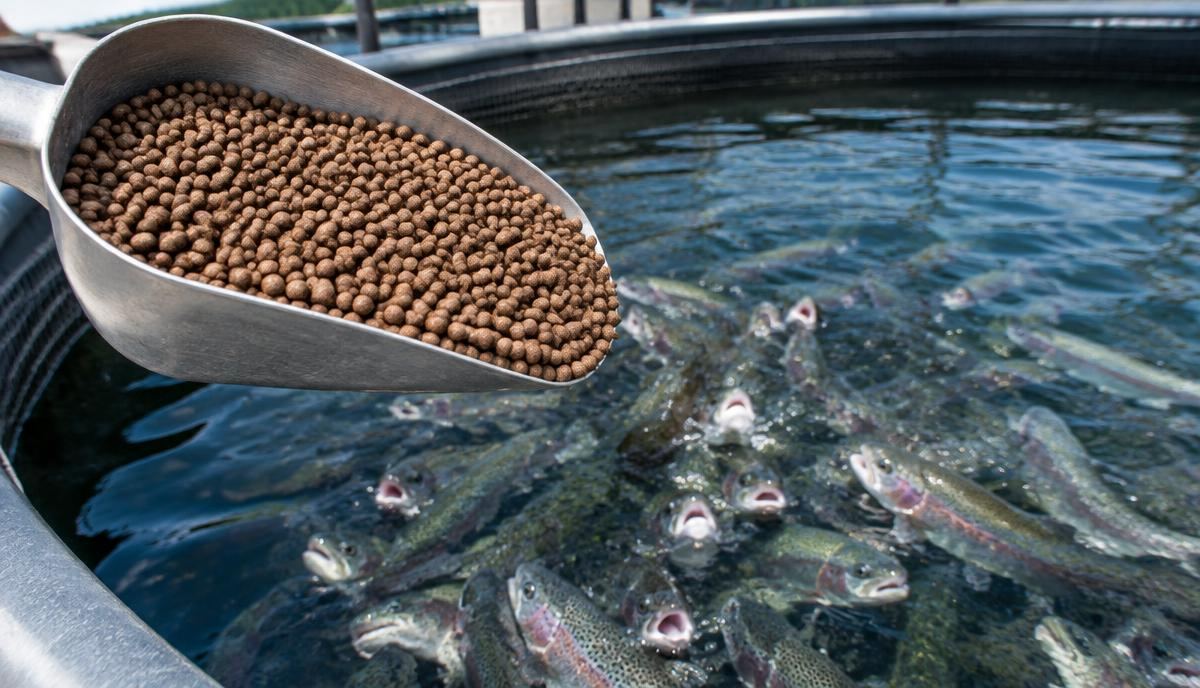
What is FCR and why does it define farm profitability?
Feed Conversion Ratio (FCR) measures how effectively aquaculture stock utilizes nutrition. It is calculated by dividing total feed distributed by total biomass gained. In commercial production, where feed is the majority of operating costs, FCR is the primary proxy for efficiency. A lower FCR indicates better conversion, reducing production cost per kilogram. Maintaining a low FCR is essential for project bankability. Using the FCR calculator helps operators project yields and manage expenses. FCR optimization is the cornerstone of modern farm economics.
How does feed conversion link feed spend to total production output?
The link between feed expenditure and production output is direct. When conversion efficiency drops, farms must purchase more feed for the same harvest, inflating what affects aquaculture opex. This makes FCR a financial metric that dictates cash flow. High-performance feeds might have a higher purchase price, but a lower FCR can reduce the total cost per kilogram compared to cheaper feeds. Analyzing the FCR cost impact allows operators to make informed procurement decisions that protect profit margins.
How do feed quality and ingredient composition influence conversion rates?
Feed nutritional profile and physical quality determine how well stock converts inputs into growth. High-quality feeds are formulated with optimal proteins and vitamins for specific life stages. If feed lacks essential nutrients or contains low-digestibility fillers, animals consume more without gaining weight, raising the FCR. Physical stability also matters; feed that crumbles or sinks too quickly is wasted. Proper fish feed and feeding system matching ensures pellets align with species behavior, reducing the environmental load on filtration.
How do automated feeding systems reduce feed waste and improve FCR?
Manual feeding often leads to overfeeding, negatively impacting FCR. Automated systems, like pneumatic spreaders, provide precise control over feed timing and quantity. These systems can integrate with sensors to prevent accumulation of uneaten feed. By delivering feed in frequent intervals, automation ensures stock ingests pellets before they leach nutrients. This precision is a key part of aquaculture automation and monitoring systems that optimize every gram of input. Reducing waste improves the conversion ratio and lowers metabolic load, improving growth rates.
How does water quality and dissolved oxygen affect metabolic efficiency?
Biological ability to process feed depends on environmental conditions. Dissolved oxygen is critical for metabolic processes that convert feed into tissue. When oxygen is low, animals experience stress and digestive efficiency drops, causing FCR to rise. Dissolved oxygen management for bankable farms is essential to maintain metabolic rates. Similarly, elevated ammonia can inhibit growth and increase maintenance energy expenditure. Effective water quality management in commercial aquaculture ensures the environment supports conversion, protecting feed investment.
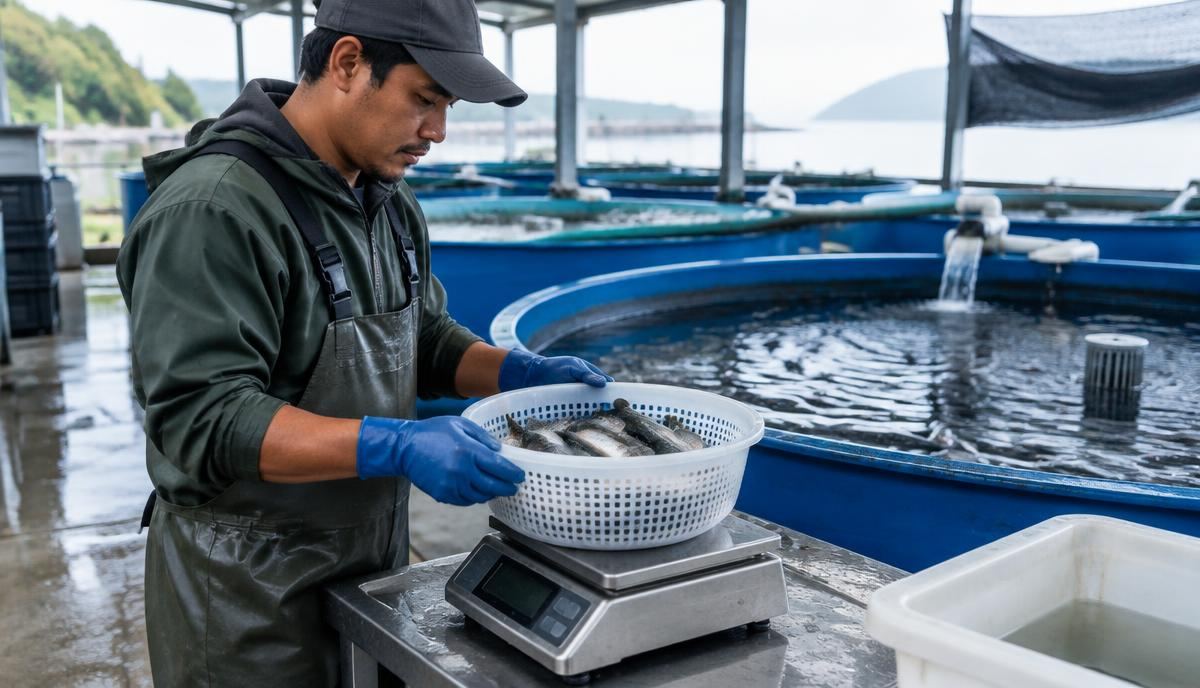
How do stocking density and genetics impact the biological FCR?
Genetic potential and stocking density significantly influence FCR. Selectively bred strains often have improved growth and better feed conversion. Investing in quality genetics via a fingerling supply and stocking plan provides a biological advantage that lowers baseline FCR. However, these benefits are negated by excessive densities. When animals are crowded, competition and stress rise, diverting energy from growth to survival. Balancing animal numbers with equipment capacity is crucial to ensure each individual has space and access to feed, allowing genetic potential to be realized.
How should commercial operators measure and monitor FCR accurately?
Accurate measurement of FCR requires record-keeping and biomass sampling. Operators must track the weight of every feed batch delivered while regularly sampling fish or shrimp to estimate biomass. This data allows calculation of economic FCR, which includes mortality and waste. Integrating these measurements into the aquaculture calculators and farm planning workflow helps managers identify issues early. If FCR drifts upward, it may indicate water quality problems, disease, or feeding issues. Comparing actual data against benchmarks allows for data-driven adjustments and provides transparency for lenders.
How does equipment choice directly influence the long-term cost of feed?
Equipment selection has a profound impact on FCR and production costs. Filtration and aeration systems contribute to environmental stability, which dictates feed utilization. A high-efficiency biofilter maintains low ammonia, supporting digestion. When sourcing, buyers should use the procurement toolkit to evaluate how technologies affect efficiency. Substandard equipment might have a lower initial price but can lead to higher FCR through inadequate oxygenation. Reliability is paramount; aeration failure causes rapid FCR spikes. By investing in reliable suppliers and infrastructure, operators protect their largest expense—feed.
How do environmental factors and temperature shifts affect feed intake?
Environmental variables, particularly seasonal temperature changes, influence metabolic rates. Fish and shrimp are ectothermic, so their metabolic speed follows water temperature. In warmer water, metabolic rates increase, leading to higher intake and potentially faster growth. Conversely, in colder water, metabolism slows and animals require less feed. Failing to adjust feeding rates to match these changes leads to waste and high FCR. Understanding these cycles is critical when developing a feed budget that accounts for fluctuations. Managers must adapt strategies in real-time based on monitoring to maintain economic stability.
How do aquaculture operators use FCR data for financial procurement?
FCR data is a vital tool for procurement and financial teams. Understanding the relationship between FCR and costs allows companies to negotiate better with feed and equipment suppliers. Accurate projections enable precise cash flow forecasting and help demonstrate project viability. When preparing a request for quote (RFQ), including FCR performance requirements filters out inefficient suppliers. This data-driven approach ensures every purchase is evaluated based on its contribution to farm profitability. By focusing on metrics that drive value, operators build resilient businesses capable of withstanding market volatility.
Checklist
Establish a baseline FCR target for each species and life stage; implement daily recording of all feed inputs by weight; conduct regular biomass sampling to track growth rates and survival; monitor dissolved oxygen levels continuously to ensure optimal metabolism; maintain water temperatures within the species-specific range for peak efficiency; calibrate automated feeding systems to minimize waste and ensure even distribution; evaluate feed quality based on nutrient digestibility and pellet stability; track the impact of equipment performance on environmental stability; review mortality rates and their direct effect on economic FCR; use financial calculators to project the impact of FCR shifts on profit margins.
Frequently asked questions
What is the difference between biological and economic FCR? Biological FCR measures the efficiency of living animals in converting feed, while economic FCR accounts for all feed purchased, including waste and mortality, reflecting true farm profitability. Why does water quality matter for feed conversion? Poor water quality, particularly low oxygen, stresses animals and reduces metabolic efficiency, leading to higher FCR and wasted feed. How can automated systems improve my bottom line? Automated systems deliver feed more precisely than manual methods, reducing waste and ensuring stock consumes nutrients before they degrade, lowering overall FCR. When should I adjust my feeding rates? Feeding rates should be adjusted based on water temperature, oxygen levels, and observed appetite to prevent overfeeding and maintain optimal conversion efficiency.
How do FishMatch Group's calculators and reviewed RFQ help?
FishMatch Group provides essential tools to optimize the economic drivers of your aquaculture project. By using our specialized calculators, you can project the impact of feed conversion on your farm's financial performance. Our human-reviewed RFQ process helps you are matched with suppliers whose equipment and inputs are suited to achieving your FCR targets. We help you navigate procurement by providing comparable offers from global manufacturers, allowing decisions based on long-term value. This professional approach reduces equipment mismatch risk and helps your infrastructure support a high-efficiency production environment.
Related: procurement toolkit, what affects aquaculture opex, aquaculture calculators and farm planning workflow.
Aquaculture planning benchmarks
| Figure | Value | Context |
|---|---|---|
| CAPEX — RAS | USD 9,000–14,000 per tonne/yr | Global baseline before country cost factor. |
| CAPEX — Ponds | USD 1,800–4,000 per tonne/yr | Lined or earthen ponds, excluding land. |
| CAPEX — Cages | USD 2,500–5,500 per tonne/yr | Cages, moorings, nets and service equipment. |
| CAPEX — Flow-through | USD 4,000–7,000 per tonne/yr | Raceways and water intake works. |
| Energy use | RAS ~6 kWh/kg; ponds ~1.2; flow-through ~1.5; cages ~0.3 | Per kg of fish produced. |
| Typical FCR | Trout 1.1; salmon 1.2; shrimp 1.4; tilapia 1.6; carp 1.8 | kg feed per kg growth; varies with feed and management. |
| Farm size where FishMatch reviews projects | From ~USD 250,000 total project value | Commercial fish and shrimp projects. |
Related articles
Why Commercial Fish Farm Projects Exceed Budget and How to Prevent Cost Overruns
Commercial aquaculture projects often go over budget due to scope gaps, hidden site costs, and logistics. This guide explains how to identify these risks and secure accurate quotes.
PlanningWhy Aquaculture Buyers Need a Written Technical Specification Before Requesting Quotes
Sending a detailed technical specification ensures you receive comparable equipment quotes, reduces the risk of expensive change orders, and provides a clear basis for system acceptance tests.
PlanningHow to Start a Commercial Shrimp Farm: A Step-by-Step Guide for Global Investors
Start a commercial shrimp farm by assessing site water quality, choosing production systems, and securing reliable aeration and post-larvae supply through a structured RFQ.
PlanningHow to Start a Commercial Tilapia Farm: A Buyer’s Guide to Systems and Equipment
Starting a commercial tilapia farm involves selecting the right production system, securing high-quality inputs, and utilizing professional sourcing platforms for technical equipment procurement.
Where this fits in a real project
Every FishMatch project runs through the same five reviewed stages, from a first enquiry to comparable quotations. See the full buyer journey.