Low Shrimp Survival or Sudden Mortality: How to Investigate the Cause
Also in:EspañolPortuguêsFrançaisРусскийTE
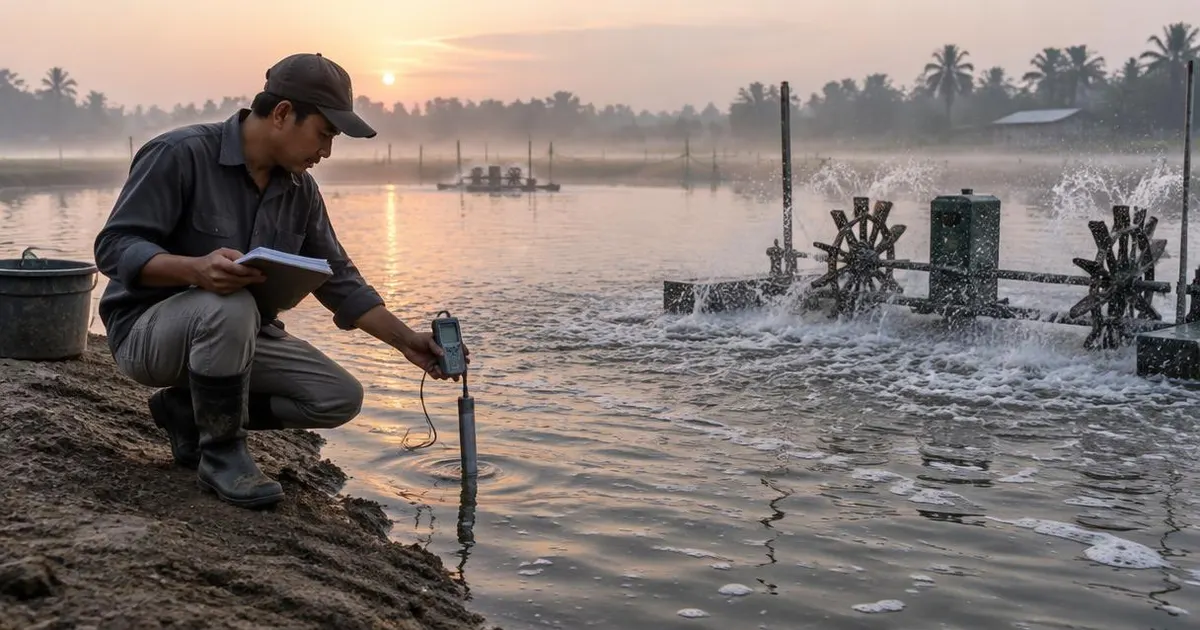
Short answer: treat low shrimp survival as an investigation, not a guess. First protect the remaining stock and call your aquatic animal-health professional if animals are dying now. Then rebuild the facts for the affected cohort — species, postlarvae (PL) source, stocking date, count and density, survival by stage, feeding and biomass estimates — and line them up against trends in dissolved oxygen, temperature, salinity, pH, ammonia, nitrite and power or aeration events. Only a qualified professional, usually with laboratory testing, can confirm a disease.
Educational guide, reviewed 13 October 2026. It gives no diagnosis, medicine or chemical advice, and no universal water-quality targets: acceptable ranges depend on species, life stage, system and your local expert protocols.
What should you do first when shrimp start dying?
- Check aeration, power supply and dissolved oxygen in the affected pond or tank immediately, and log the reading with time and location.
- Contact your aquatic animal-health professional or diagnostic laboratory and ask how to collect and preserve samples. Do not improvise sampling for disease testing.
- Check your country's reporting rules. Diseases listed by the World Organisation for Animal Health (WOAH Aquatic Code) are reported through national authorities, and local rules may add others.
- Pause non-essential movement of shrimp, water, nets and equipment between units until advised otherwise.
- Do not start medicines, disinfectants or other chemical treatments without a professional diagnosis and local approval.
How do you define the affected cohort and the size of the loss?
A survival figure is only as reliable as the counts behind it. Write down the cohort before discussing causes:
| Record | Why it matters |
|---|---|
| Species and PL source, batch and stocking date | Links the loss to one supply event and its documents |
| Number stocked, area or volume, density | Sets the starting count every survival estimate depends on |
| PL health and transport records, acclimation notes | Separates early losses after stocking from later grow-out losses |
| Survival by stage: nursery, transfer, grow-out | Shows when the loss happened, not just how large it is |
| Sampling dates, method, count and average weight | Biomass and survival estimates come from these samples |
| Daily feed given and feed-tray observations | A falling feeding response often precedes visible mortality |
| Partial harvests, transfers and counted dead animals | Prevents removals being mistaken for mortality |
Estimated survival is usually back-calculated from biomass: estimated biomass divided by average sampled weight gives an estimated count. Small errors in either number move survival a lot, so record how both were measured. The biomass calculator shows the arithmetic, and the shrimp survival and profit calculator shows how different survival assumptions change harvest volume — neither replaces a count.
Which water-quality trends should be pulled for the event?
Look at trends across the days before the event, not a single reading. FAO's shrimp pond manual explains how salinity, temperature, dissolved oxygen, pH and nitrogen compounds affect shrimp growth and survival (FAO water quality management). It is a legacy training manual written for pond culture, so use it for principles and take limits from current species- and system-specific guidance.
- Dissolved oxygen, especially night and dawn readings, with the measurement depth and position.
- Temperature, salinity and pH, including the daily pH swing in ponds.
- Total ammonia nitrogen and nitrite; ammonia toxicity changes with pH and temperature, so record them together.
- Locally relevant parameters your protocol already measures, such as alkalinity, transparency or plankton condition, hydrogen sulphide or rainfall.
- Instrument calibration dates, so a sensor fault is not mistaken for a water event.
Did power, aeration, water exchange or handling change before the losses?
Many investigations turn on timing. Build a timeline that places mortality against operational events:
| Time window | What to collect |
|---|---|
| 7–14 days before | Stocking or transfers, feed changes, sampling, water exchange or intake changes |
| 48 hours before | Power cuts, aerator or blower stops, generator start-up, weather, heavy rain |
| Night before | Aerator run hours, dawn oxygen, shrimp behaviour at the surface or edges |
| Event day | Time first noticed, units affected and not affected, counts of dead animals |
Comparing affected and unaffected units that share water, feed or PL batches is often more informative than any single reading.
When is farm monitoring enough, and when is a laboratory or veterinary investigation needed?
| Who | Role |
|---|---|
| Farm team | Routine monitoring, records, timeline, equipment checks, protecting unaffected units |
| Diagnostic laboratory or pathology service | Sample testing and pathogen confirmation using agreed methods |
| Aquatic animal-health professional or veterinarian | Interpreting evidence, deciding on any treatment within local rules, advising on reporting |
| Competent authority | Receives notifications where national rules or WOAH-listed diseases require it |
Urgent or unexplained mortality should go to professionals the same day. Similar signs can come from oxygen depletion, water-quality problems or different infections, so do not treat a pattern of symptoms as a diagnosis. For a wider first-response routine, see the first-response checklist.
How does the investigation lead to a project or equipment decision?
Only once the evidence points to a farm or system cause — for example repeated dawn oxygen deficits, missing backup power or insufficient nursery capacity — does it become a requirements question. Test aeration margins with the shrimp oxygen risk calculator and the oxygen requirement calculator, then write the measured problem, the required outcome and site conditions into a project request. The FishMatch team reviews it and approaches suitable suppliers for written, comparable proposals. See also aeration in tropical shrimp ponds.
Sources: FAO — Shrimp culture: water quality management; FAO — Shrimp culture: grow-out, nursing and acclimation; WOAH Aquatic Animal Health Code. FAO pond material dates from earlier production systems; confirm current practice with local experts.
Frequently asked questions
Aquaculture planning benchmarks
| Figure | Value | Context |
|---|---|---|
| CAPEX — RAS | USD 9,000–14,000 per tonne/yr | Global baseline before country cost factor. |
| CAPEX — Ponds | USD 1,800–4,000 per tonne/yr | Lined or earthen ponds, excluding land. |
| CAPEX — Cages | USD 2,500–5,500 per tonne/yr | Cages, moorings, nets and service equipment. |
| CAPEX — Flow-through | USD 4,000–7,000 per tonne/yr | Raceways and water intake works. |
| Energy use | RAS ~6 kWh/kg; ponds ~1.2; flow-through ~1.5; cages ~0.3 | Per kg of fish produced. |
| Typical FCR | Trout 1.1; salmon 1.2; shrimp 1.4; tilapia 1.6; carp 1.8 | kg feed per kg growth; varies with feed and management. |
| Farm size where FishMatch reviews projects | From ~USD 250,000 total project value | Commercial fish and shrimp projects. |
Related articles
Where this fits in a real project
Every FishMatch project runs through the same five reviewed stages, from a first enquiry to comparable quotations. See the full buyer journey.
Planning a commercial aquaculture project?
Send your project brief. A FishMatch specialist reviews it before relevant suppliers are contacted privately.
Request a quote