How to Improve Shrimp Growth and Feed Efficiency: Find the Bottleneck First
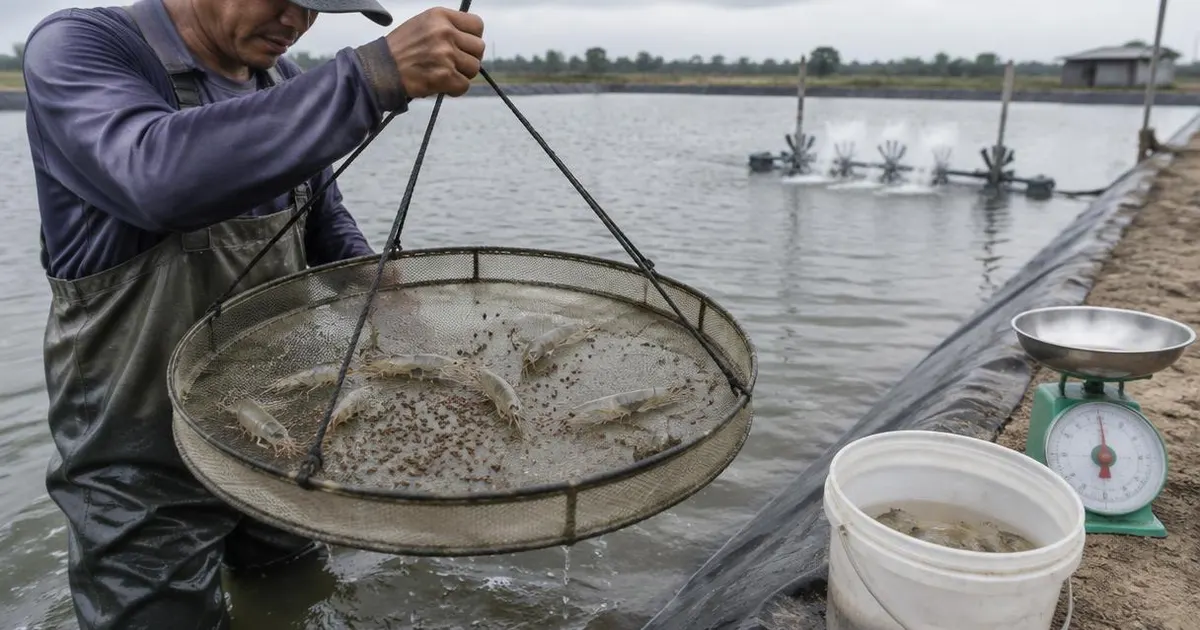
Short answer: slow growth and a rising feed conversion ratio (FCR) are symptoms, not causes. Before changing feed, density or equipment, check whether the numbers are real — sampling method, size distribution and biomass estimate — then work through feeding response, feed batch and storage, water quality and oxygen, stocking density and the harvest schedule. Use calculators to model what a change would be worth, but base decisions on farm measurements.
Educational guide, reviewed 13 October 2026. It does not set universal growth, FCR or water-quality targets: these depend on species, strain, life stage, system, feed and local expert protocols. It gives no health or treatment advice.
Is the growth problem real, or a sampling artefact?
Average weight drives every biomass, feed and FCR figure on a shrimp farm, so start with how it was measured.
- Record the sampling method (cast net, feed tray, lift net), the sampling points, the time of day and the number of animals weighed.
- Look at the size distribution, not only the mean. A wide spread can mean uneven feeding access, mixed PL batches or several cohorts; a cast net can also select for certain sizes.
- Write down how biomass was estimated. If biomass comes from an assumed survival, FCR inherits that assumption.
- Keep the method constant between samples, otherwise a change in method looks like a change in growth.
What does the feeding response tell you?
FAO's technical review on on-farm feeding describes feed management as matching the ration to the animals' actual demand and observing the response (FAO, on-farm feeding and feed management). On shrimp ponds this usually means feed-tray checks: how much is left after a set time, at which trays, and how that changes with weather, oxygen or moulting. Record adjustments with their reason, so an overfeeding pattern can be seen later.
Is the feed itself consistent?
Feed composition varies between ingredients and batches; FAO's review of feed variability, written for animal feeds generally, explains why composition data must be current and specific to be useful (FAO, variability in feed composition). For shrimp feed, ask for and file:
- Batch or lot number, manufacturing date and declared analysis for every delivery.
- Storage conditions: dry, shaded, ventilated, off the floor, used in order of arrival.
- Pellet size and stability appropriate to the shrimp size, as specified by the manufacturer.
- Any change of brand, formula or supplier, dated against growth records.
Are water quality and oxygen limiting feeding?
FAO's pond manual links water quality directly to growth and survival (FAO water quality management). Compare feeding response with dissolved oxygen trends, temperature, salinity, pH, ammonia and nitrite. A demand for more feed also raises oxygen demand, so test aeration margins with the shrimp oxygen risk calculator before increasing rations or density. Acceptable ranges are species- and system-specific; use your local protocol.
Is stocking density or the harvest schedule the bottleneck?
A density that worked at stocking can limit growth later as biomass rises. Partial harvests, transfer timing and final harvest size change biomass, oxygen demand and feed use, so record them in the same file as growth samples.
| What the records show | What to check | Evidence to collect |
|---|---|---|
| Mean weight flat, wide size spread | Sampling method, PL batches, feeding access | Repeat samples with the same method; batch records |
| Feed left on trays, rations rising | Overfeeding, appetite changes, oxygen at feeding time | Tray logs, feeding times, DO at feeding |
| Growth slows after a feed change | Feed batch, storage, pellet size | Lot numbers, storage notes, manufacturer data |
| Growth slows as biomass rises | Density, aeration margin, water exchange | Biomass estimates, DO trends, aerator run hours |
| FCR jumps without growth change | Biomass or survival estimate error | Counts, partial-harvest records, recalculated biomass |
Does the same diagnosis apply to fish farms?
Yes, with system-specific checks. In fish ponds and cages, watch feeding response directly (floating feed, surface activity or cameras) and stop at satiation; in RAS, compare feeding with oxygen supply, solids and ammonia removal before raising rations. Sampling, size distribution, feed batch records and a consistent FCR definition matter in the same way. Use the fish growth calculator to compare growth scenarios from your own weights, and see choosing feed and a feeding plan for species, stage and system.
How do survival, feed, energy and saleable harvest change cost per kg?
Cost per kilogram is total cycle cost divided by saleable kilograms. Feed cost depends on FCR and feed price; FCR is feed given divided by weight gained, so losses after feeding raise it (FCR guide). Survival affects both the numerator (PL, feed already eaten) and the denominator (fewer kilograms sold). Energy for aeration and pumping is spread over the same saleable kilograms, and size grade changes the price received.
- FCR calculator: FCR from your feed and biomass records, and the feed cost of a gap to your own target.
- Shrimp cost per kg calculator: feed, PL, electricity, labour and other costs per saleable kilogram.
- Shrimp survival and profit calculator: harvest and margin under different survival assumptions.
- Shrimp farm calculator: annual harvest, feed and gross margin for an area and density.
These tools model scenarios from numbers you enter; they do not measure your farm, predict results or replace sampling. Defaults are examples, not benchmarks. For a fuller worked example, see shrimp farming economics.
When does a growth problem become an equipment or supplier question?
When records show a measured system limit — for example oxygen margins at the planned biomass, uneven feed distribution across large ponds, or missing nursery capacity — define the outcome you need (target harvest, cycle plan, measured constraint) and the site conditions, then submit a project request. FishMatch reviews it and asks suitable suppliers for written proposals on the same basis, so they can be compared.
Sources: FAO — On-farm feeding and feed management in aquaculture; FAO — Variability in feed composition; FAO — Shrimp culture: water quality management; FAO — Shrimp culture: grow-out. The FAO pond manual is legacy material; check current practice for your species and system.
Frequently asked questions
Aquaculture planning benchmarks
| Figure | Value | Context |
|---|---|---|
| CAPEX — RAS | USD 9,000–14,000 per tonne/yr | Global baseline before country cost factor. |
| CAPEX — Ponds | USD 1,800–4,000 per tonne/yr | Lined or earthen ponds, excluding land. |
| CAPEX — Cages | USD 2,500–5,500 per tonne/yr | Cages, moorings, nets and service equipment. |
| CAPEX — Flow-through | USD 4,000–7,000 per tonne/yr | Raceways and water intake works. |
| Energy use | RAS ~6 kWh/kg; ponds ~1.2; flow-through ~1.5; cages ~0.3 | Per kg of fish produced. |
| Typical FCR | Trout 1.1; salmon 1.2; shrimp 1.4; tilapia 1.6; carp 1.8 | kg feed per kg growth; varies with feed and management. |
| Farm size where FishMatch reviews projects | From ~USD 250,000 total project value | Commercial fish and shrimp projects. |
Related articles
Where this fits in a real project
Every FishMatch project runs through the same five reviewed stages, from a first enquiry to comparable quotations. See the full buyer journey.
Planning a commercial aquaculture project?
Send your project brief. A FishMatch specialist reviews it before relevant suppliers are contacted privately.
Request a quote