Capacity Bottleneck Audit for Existing Fish and Shrimp Farms: Oxygen, Water, Feed, Power and People
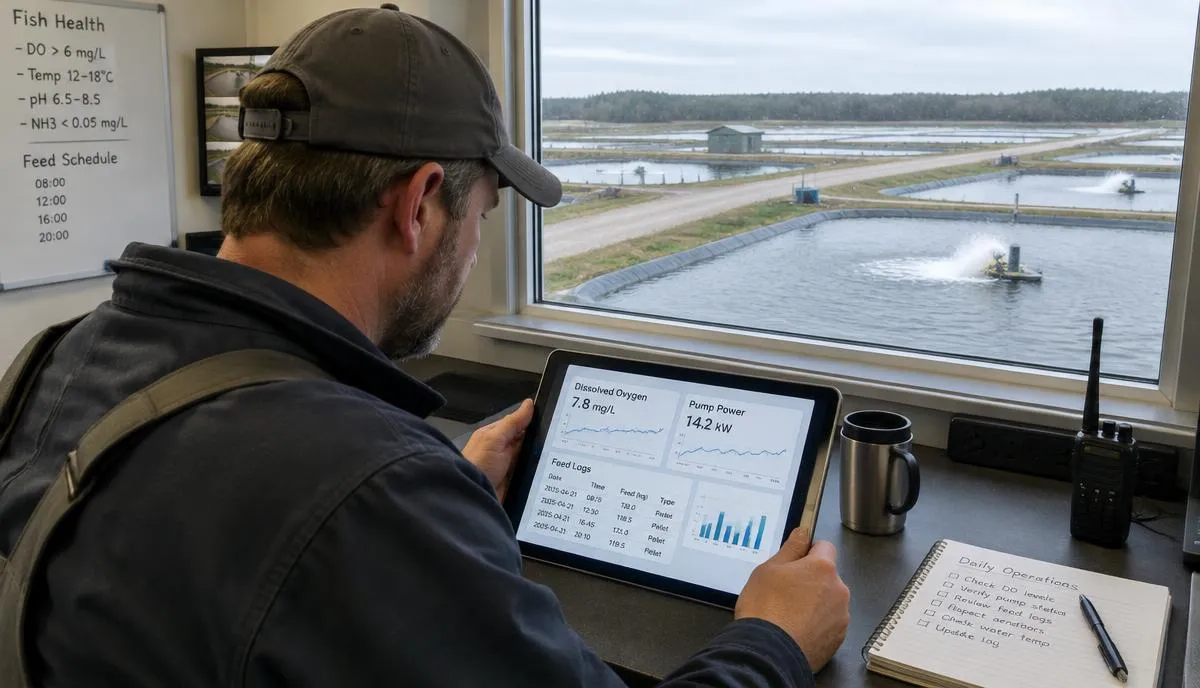
Short answer: an existing farm's output is limited by its weakest system at the worst moment of the cycle, usually oxygen on the hottest night at peak biomass, then water treatment, power, feed logistics or labour. Find it by collecting a few weeks of real records (biomass, feed, dissolved oxygen, power draw, mortality, labour hours), checking each system at peak load, and ranking upgrades by how much extra safe biomass each one unlocks per unit of cost. Buy equipment only after the bottleneck is named.
Who this is for
Owners and operations managers of existing ponds, cages, flow-through farms or RAS who want more output or better survival from what they already own.
Step 1: collect four to eight weeks of records
- Standing biomass and feed per unit per day.
- Dissolved oxygen at dawn and at feeding time, with temperature.
- Ammonia, nitrite, pH and solids where measured.
- Mortality by unit and by day.
- Power draw and outages; generator run hours.
- Labour hours by task, including night checks.
If records are missing, fix that first — it is usually the cheapest upgrade. See optical vs electrochemical DO sensors.
Step 2: check systems in this order
| Order | System | Sign it is the bottleneck | First thing to check |
|---|---|---|---|
| 1 | Oxygen / aeration | Dawn DO falls near the limit for your species at peak biomass; feeding cut back on hot days | Installed aeration vs oxygen demand at peak feed |
| 2 | Water treatment / exchange | Ammonia, nitrite or solids rise with feed; disease pressure rises with density | Treatment capacity at target feed load |
| 3 | Power | Aerators or pumps cannot run together; outages | Peak draw vs supply and standby capacity |
| 4 | Feed and feeding | Feed waste, uneven growth, staff cannot feed often enough | Feed response, feeding frequency, storage |
| 5 | Stocking and juveniles | Ponds or tanks sit empty between cycles | Fingerling / postlarvae supply and nursery capacity |
| 6 | Labour and skills | Night checks skipped, records incomplete | Hours per task; alarm response |
| 7 | Market and harvest | Stock held past target size | Harvest scheduling, cold chain, buyers |
Oxygen is first because it usually limits biomass soonest and fails fastest; see dissolved oxygen management and the shrimp aeration guide. For shrimp, also see growth and feed efficiency bottlenecks.
Step 3: estimate safe biomass per system
For each system, estimate the standing biomass it can support at the worst condition you expect (hottest night, highest feed day, one unit out of service). The lowest number is your current capacity; the next lowest is what you gain if you fix the first bottleneck. This is why fixing aeration alone may only move the limit to water treatment or power.
Step 4: rank upgrades
| Upgrade | A. Extra safe biomass unlocked | B. Installed cost | C. Extra running cost / year | Rank by A ÷ B, check C |
|---|---|---|---|---|
| Example: more aeration | ||||
| Example: power / generator | ||||
| Example: treatment capacity | ||||
| Example: monitoring and alarms |
Fill in your own estimates and supplier quotes. Survival improvements count too: lower mortality at the same stocking is extra harvest without extra units. Use the FCR cost impact and mortality cost resources to put a value on them.
Who should be in the audit
| Role | Contribution |
|---|---|
| Owner | Target output, budget and risk appetite |
| Operations manager | Records, daily constraints, staff realities |
| Engineer | Capacity checks for oxygen, flow, power and treatment |
| Purchasing | Supplier lead times, service and spare-part terms |
| Aquatic animal-health professional | Health and biosecurity factors behind mortality |
| Consultant | Independent review of assumptions |
Sources and limits
Background: FAO — A guide to recirculation aquaculture; Southern Regional Aquaculture Center fact sheets; Global Seafood Alliance — Responsible Seafood Advocate. This audit identifies where to look; it is not a substitute for on-site engineering or veterinary assessment. FishMatch does not promise yield or survival gains.
Next step
Send your audit findings in a short upgrade assessment request, or use the problem solver to match symptoms to guides. The expansion and upgrade guide covers expansion, intensification and modernization routes.
Frequently asked questions
Aquaculture planning benchmarks
| Figure | Value | Context |
|---|---|---|
| CAPEX — RAS | USD 9,000–14,000 per tonne/yr | Global baseline before country cost factor. |
| CAPEX — Ponds | USD 1,800–4,000 per tonne/yr | Lined or earthen ponds, excluding land. |
| CAPEX — Cages | USD 2,500–5,500 per tonne/yr | Cages, moorings, nets and service equipment. |
| CAPEX — Flow-through | USD 4,000–7,000 per tonne/yr | Raceways and water intake works. |
| Energy use | RAS ~6 kWh/kg; ponds ~1.2; flow-through ~1.5; cages ~0.3 | Per kg of fish produced. |
| Typical FCR | Trout 1.1; salmon 1.2; shrimp 1.4; tilapia 1.6; carp 1.8 | kg feed per kg growth; varies with feed and management. |
| Farm size where FishMatch reviews projects | From ~USD 250,000 total project value | Commercial fish and shrimp projects. |
Related articles
Where this fits in a real project
Every FishMatch project runs through the same five reviewed stages, from a first enquiry to comparable quotations. See the full buyer journey.
Planning a commercial aquaculture project?
Send your project brief. A FishMatch specialist reviews it before relevant suppliers are contacted privately.
Request a quote