Retrofit or Replace? A Decision Framework for Existing Fish and Shrimp Farm Equipment
Also in:العربية
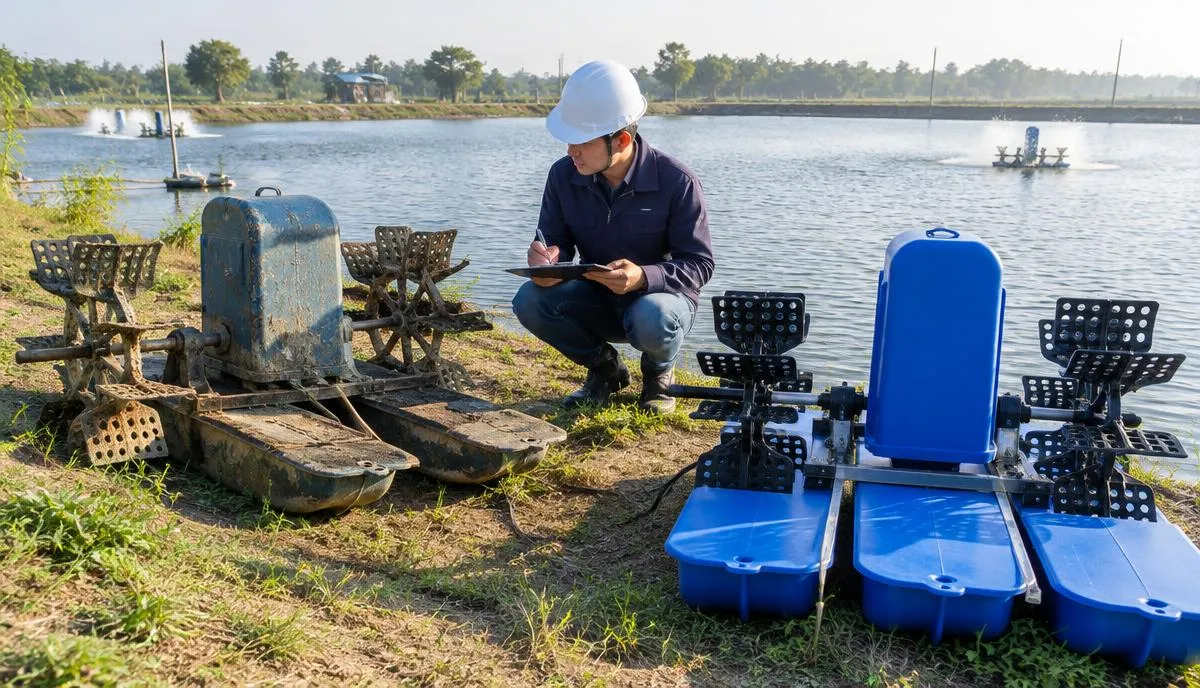
Short answer: retrofit when the unit's structure is sound and the problem is one component, control or efficiency gap; replace when the duty has outgrown the design, failures are frequent, parts are no longer available, or the cost of a failure (stock loss, downtime) is higher than the saving from keeping it. Decide per system on four facts you can measure on your own farm: condition, remaining duty headroom, lifecycle cost and consequence of failure — not on age or purchase price alone.
Who this is for
Owners and managers of operating fish or shrimp farms who are planning an upgrade, plus the engineers, purchasing staff and consultants who will specify it. If you are planning a new farm, start with how to plan a commercial aquaculture project instead.
Step 1: record the facts for each system
- **Condition:** corrosion, bearing and gearbox wear, motor insulation, liner or tank damage, leaks.
- **Duty headroom:** what the unit delivers today against what the farm needs at peak biomass (oxygen, flow, head, solids removal).
- **Failure history:** breakdowns and hours of downtime over the last 12–24 months.
- **Parts and service:** whether spare parts and local service are still available, and lead times.
- **Running cost:** measured power use, consumables and maintenance labour.
Measured figures beat nameplate figures. A clamp meter on a motor and a few weeks of dissolved oxygen logs tell you more than the original datasheet.
Step 2: compare the three options
| Question | Repair | Retrofit | Replace |
|---|---|---|---|
| Structure and housing sound? | Yes | Yes | Not necessarily |
| Duty still matches farm needs? | Yes | Close — gap closed by new component or control | No — farm has outgrown it |
| Parts available? | Yes | Yes, or substitute available | No or long lead time |
| Typical scope | Bearings, seals, impeller, membrane | New motor/drive (VFD), controls, sensors, diffusers, media, automation | New unit, often with new foundations, cabling or pipework |
| Disruption to production | Low | Low to medium | Medium to high — plan the change-over |
| Main risk | Recurring failure | Interface between old and new parts | Commissioning and change-over |
Step 3: put lifecycle cost side by side
Use the same horizon (for example, five years) for each option and fill in your own quotes and records:
| Cost line | Keep / repair | Retrofit | Replace |
|---|---|---|---|
| A. Upfront cost (installed) | |||
| B. Energy per year | |||
| C. Maintenance and parts per year | |||
| D. Expected downtime cost per year | |||
| E. Residual value at end of horizon | |||
| Total = A + horizon × (B + C + D) − E |
Downtime cost is the line most often left out. For an aerator, it is the stock at risk if oxygen is lost on a critical night, not just the repair bill. The FishMatch TCO comparison calculator runs this comparison with your figures.
Step 4: weigh the consequence of failure
Systems that keep animals alive within hours — aeration and oxygen, circulation pumps in RAS, backup power and alarms — deserve a lower tolerance for risk than systems whose failure only slows work, such as graders or feed storage. On critical systems, redundancy (a standby unit) can be worth more than a newer duty unit. See fish farm backup power and dissolved oxygen management.
Common retrofit options by system
| System | Common retrofit | Check before buying |
|---|---|---|
| Paddlewheel / aerators | Variable-speed drive, DO-linked control, gearbox or motor change | Real oxygen demand at peak biomass; power supply capacity |
| Blowers and diffusers | Higher-efficiency diffusers, blower control | Back-pressure, diffuser depth, blower curve |
| Pumps | Impeller trim or replacement, VFD, pipework changes | Actual flow and head; pump curve at operating point |
| Mechanical filtration | Finer screens, drum filter backwash control | Solids load at target feed rate |
| Biofilter | Additional media, aeration upgrade | Nitrification capacity at target feed load (FAO) |
| Monitoring | Optical DO sensors, central alarms | Maintenance routine and who answers alarms |
| Feeding | Automatic or demand feeders | Feed response and waste today |
Decision-maker roles
| Role | What they need to see |
|---|---|
| Owner / investor | Lifecycle cost, payback range, risk to stock and revenue |
| Operations manager | Disruption plan, staff workload, maintenance routine |
| Engineer | Measured duty, interfaces with existing equipment, controls |
| Purchasing | Comparable scopes, warranty, parts and service terms |
| Consultant / adviser | Assumptions, data quality, alternatives considered |
Mistakes to avoid
- Replacing on age alone when the real problem is control or maintenance.
- Retrofitting a unit whose duty the farm has already outgrown.
- Comparing quotes on purchase price without energy, downtime and parts.
- Mixing old and new components without checking electrical, hydraulic and control compatibility.
Sources and limits
Background: FAO — A guide to recirculation aquaculture; Southern Regional Aquaculture Center fact sheets; Global Seafood Alliance — Responsible Seafood Advocate. This article gives a decision method, not performance guarantees. Savings and payback depend on your measured data and on supplier quotes; FishMatch does not promise specific results.
Next step
Bring your condition records and the systems you are unsure about to a short upgrade assessment request. We review it, then help you scope a comparable retrofit-vs-replace request to qualified suppliers. You can also start with the expansion and upgrade guide.
Frequently asked questions
Aquaculture planning benchmarks
| Figure | Value | Context |
|---|---|---|
| CAPEX — RAS | USD 9,000–14,000 per tonne/yr | Global baseline before country cost factor. |
| CAPEX — Ponds | USD 1,800–4,000 per tonne/yr | Lined or earthen ponds, excluding land. |
| CAPEX — Cages | USD 2,500–5,500 per tonne/yr | Cages, moorings, nets and service equipment. |
| CAPEX — Flow-through | USD 4,000–7,000 per tonne/yr | Raceways and water intake works. |
| Energy use | RAS ~6 kWh/kg; ponds ~1.2; flow-through ~1.5; cages ~0.3 | Per kg of fish produced. |
| Typical FCR | Trout 1.1; salmon 1.2; shrimp 1.4; tilapia 1.6; carp 1.8 | kg feed per kg growth; varies with feed and management. |
| Farm size where FishMatch reviews projects | From ~USD 250,000 total project value | Commercial fish and shrimp projects. |
Related articles
Where this fits in a real project
Every FishMatch project runs through the same five reviewed stages, from a first enquiry to comparable quotations. See the full buyer journey.
Planning a commercial aquaculture project?
Send your project brief. A FishMatch specialist reviews it before relevant suppliers are contacted privately.
Request a quote