Fish Farm Equipment Upgrades for Existing Farms: Cost Drivers and a Realistic ROI Model
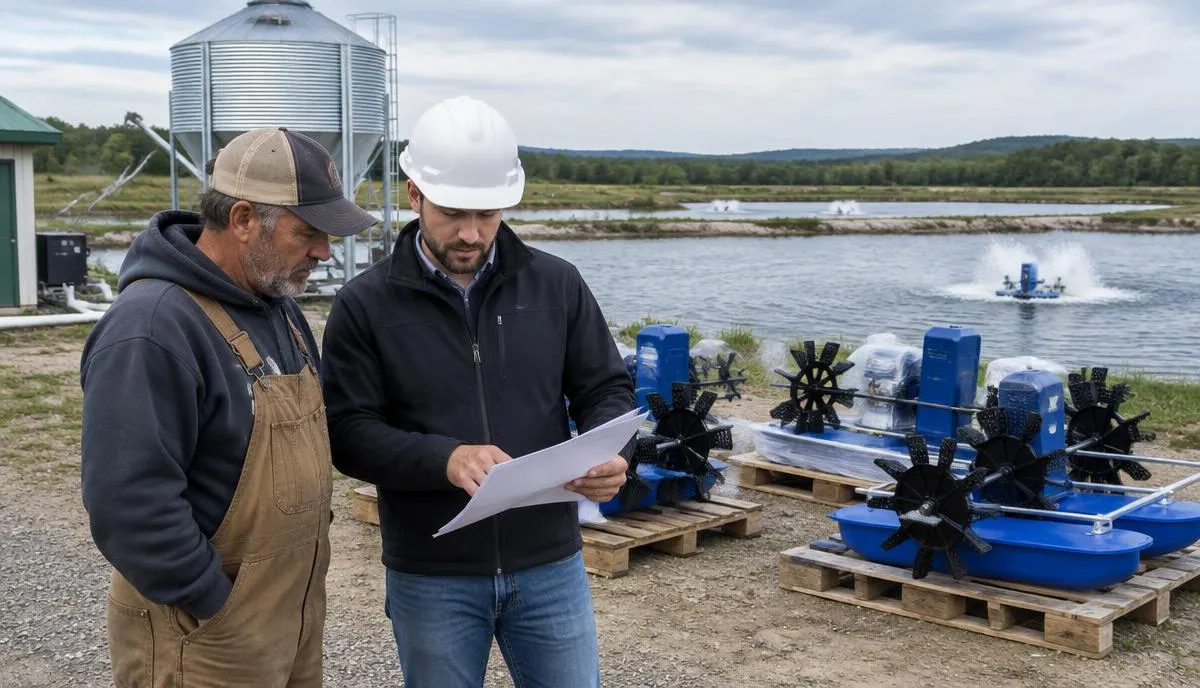
Short answer: for an existing farm, fish farm equipment is worth buying only when it removes a measured bottleneck or cuts a measured cost. Model each upgrade with your own numbers: extra margin per year = (extra harvest × margin per kg) + (feed, energy and labour saved) + (avoided losses), minus extra running costs. Simple payback = full installed cost ÷ that figure. Then test it against a lower-performance case. A payback that only works in the best case is a risk, not an investment.
Who this is for
Owners, operations managers, engineers and purchasing staff at operating fish or shrimp farms, ponds, tanks or indoor RAS, who are pricing an upgrade or expansion. New-farm buyers should start with the fish farming equipment guide.
Step 1: name what the upgrade must change
Write one line per upgrade: the bottleneck it removes, or the cost it cuts, and how you measured it. If you cannot write that line, run the capacity bottleneck audit first.
Step 2: price the full installed cost, not the equipment price
| Cost driver | Why it matters on an existing farm |
|---|---|
| Equipment ex-works | Often the smallest share of the total on retrofits |
| Freight, duties and local taxes | Depend on origin and Incoterms; see Incoterms for aquaculture equipment |
| Electrical upgrades | New loads may need cabling, panels, transformer or generator capacity |
| Civil and pipework changes | Foundations, pipe re-routing, drainage |
| Installation and tie-in labour | Working around live stock costs more time |
| Controls, sensors and integration | Linking new units to existing alarms and monitoring |
| Commissioning and training | Testing at design load, staff handover |
| Production disruption | Reduced feeding or delayed stocking during works |
| Spares and service | First-year parts and local service coverage |
Indoor farms add building-related costs: ventilation, humidity control, floor loads and access for large equipment; see buildings and enclosures.
Step 3: build the ROI model
| Line | Formula | Where the number comes from |
|---|---|---|
| A. Extra harvest (kg/yr) | Extra safe biomass × cycles per year, or survival gain × stocked kg | Bottleneck audit; trial on part of the farm |
| B. Margin per extra kg | Price − variable cost per kg | Sales and cost records |
| C. Feed saved / yr | Harvest × (current FCR − expected FCR) × feed price | FCR payback checklist |
| D. Energy and labour saved / yr | Measured kWh and hours before vs expected after | Meter readings, timesheets |
| E. Avoided losses / yr | Expected stock loss avoided (for example, from oxygen failure) | Your loss history; be conservative |
| F. Extra running costs / yr | Energy, consumables, maintenance, service contracts | Supplier quotes |
| G. Net annual benefit | A × B + C + D + E − F | |
| H. Full installed cost | Step 2 total | Quotes |
| Simple payback (years) | H ÷ G |
Step 4: test a downside case
| Assumption | Base case | Downside case |
|---|---|---|
| Extra harvest | Your expected figure | Half of it, or a one-cycle delay |
| FCR improvement | Trial result | Half the trial improvement |
| Installed cost | Quote total | Quote + contingency for tie-ins |
| Energy price | Current tariff | Higher tariff |
If the downside payback is longer than the equipment's expected service life or your financing term, the upgrade needs a smaller scope, a phased approach or a different option. The TCO comparison and expansion readiness calculators run these cases with your figures.
New, refurbished or used equipment?
Many searches for fish farm equipment for sale come from operators replacing or adding units. FishMatch does not sell equipment; it helps buyers compare written quotes from third-party suppliers. Whatever the source, compare like for like:
| Option | Upfront cost | Main risks | Ask for |
|---|---|---|---|
| New | Highest | Lead time | Warranty terms, spares list, commissioning scope |
| Refurbished by maker or dealer | Lower | Remaining life unclear | What was replaced, test records, warranty |
| Used, as-is | Lowest | Hidden wear, biosecurity, no parts or support | Service history, disinfection, parts availability, compatibility with your controls |
Second-hand equipment that has held live animals can carry biosecurity risk; agree cleaning and disinfection with your aquatic animal-health professional before it enters the site.
Upgrade options compared
| Upgrade | What it usually changes | Check before buying |
|---|---|---|
| Aeration / oxygen | Safe biomass, survival on critical nights | Peak oxygen demand, power and backup |
| Monitoring and alarms | Response time, avoided losses | Who answers alarms; sensor maintenance (DO sensors) |
| Automatic feeding | Feed waste, labour, FCR | Feed response today; control integration |
| Water treatment / RAS modules | Water quality at higher feed load | Treatment capacity at target feed (FAO — A guide to recirculation aquaculture) |
| Pumps and drives | Energy per m³ | Actual duty point vs pump curve |
| Backup power | Avoided losses from outages | Load to be covered, transfer time |
Decision-makers and what they need
| Role | Needs from the model |
|---|---|
| Owner / investor | Base and downside payback, cash needed, risk to stock |
| Operations | Disruption schedule, workload, training |
| Engineer | Duty, interfaces with existing systems, commissioning tests |
| Purchasing | Comparable scopes, freight terms, warranty, spares |
| Consultant / lender | Clear assumptions and sources for every input |
Sources and limits
Background: FAO — A guide to recirculation aquaculture; Southern Regional Aquaculture Center fact sheets. This is a planning model, not financial advice, and FishMatch does not promise yields, survival or payback. Inputs should come from your farm's records and written supplier quotes.
Next step
Send the bottleneck, the upgrade you are considering and your current output in a short upgrade assessment request. We review it and help you prepare a like-for-like quote request. See also retrofit or replace, RAS expansion without disruption and the expansion and upgrade guide.
Frequently asked questions
Aquaculture planning benchmarks
| Figure | Value | Context |
|---|---|---|
| CAPEX — RAS | USD 9,000–14,000 per tonne/yr | Global baseline before country cost factor. |
| CAPEX — Ponds | USD 1,800–4,000 per tonne/yr | Lined or earthen ponds, excluding land. |
| CAPEX — Cages | USD 2,500–5,500 per tonne/yr | Cages, moorings, nets and service equipment. |
| CAPEX — Flow-through | USD 4,000–7,000 per tonne/yr | Raceways and water intake works. |
| Energy use | RAS ~6 kWh/kg; ponds ~1.2; flow-through ~1.5; cages ~0.3 | Per kg of fish produced. |
| Typical FCR | Trout 1.1; salmon 1.2; shrimp 1.4; tilapia 1.6; carp 1.8 | kg feed per kg growth; varies with feed and management. |
| Farm size where FishMatch reviews projects | From ~USD 250,000 total project value | Commercial fish and shrimp projects. |
Related articles
Where this fits in a real project
Every FishMatch project runs through the same five reviewed stages, from a first enquiry to comparable quotations. See the full buyer journey.
Planning a commercial aquaculture project?
Send your project brief. A FishMatch specialist reviews it before relevant suppliers are contacted privately.
Request a quote