FCR Improvement Payback: Cost, ROI and Procurement Checklist Before Buying Equipment
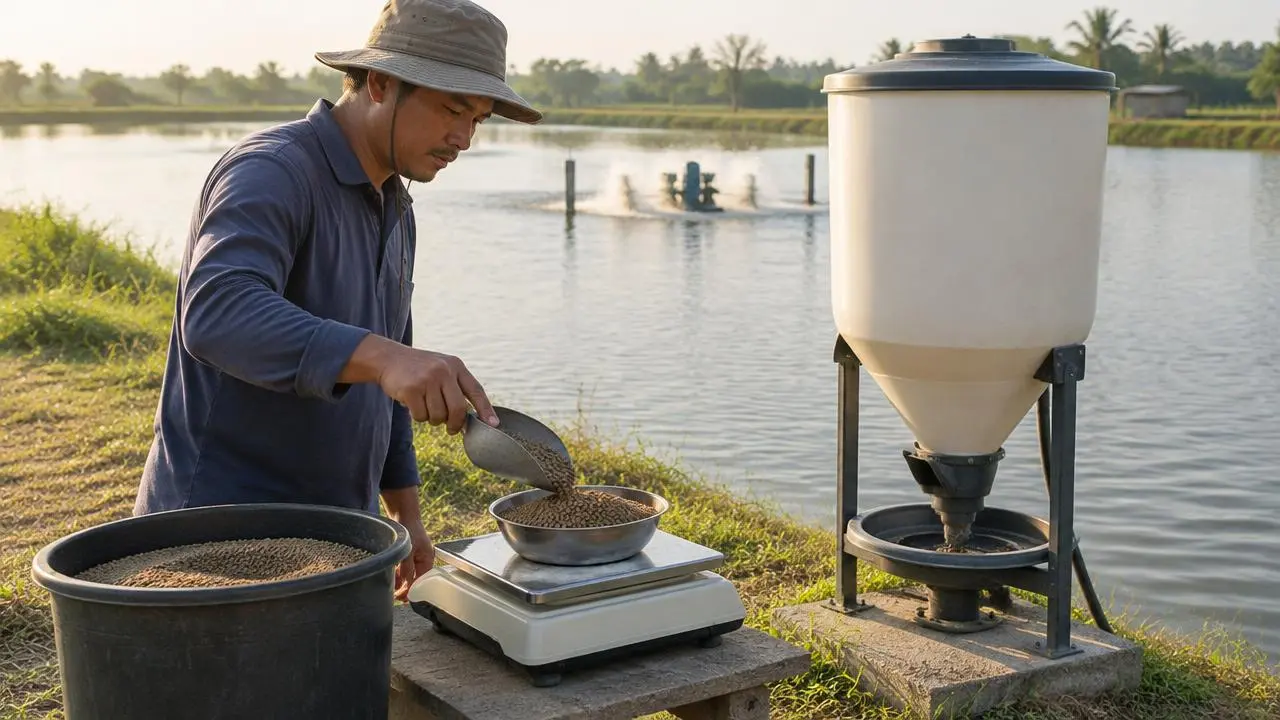
Short answer: before buying feeders, sensors or extra aeration to cut FCR, work out the payback from your own numbers. Feed saved per cycle = harvest (kg) × (current FCR − expected FCR). Money saved = feed saved × feed price per kg. Payback (cycles) = full installed cost ÷ (money saved per cycle − extra running costs per cycle). If the expected FCR is a guess, the payback is a guess too, so test the improvement on part of the farm first.
What is FCR?
Feed conversion ratio (FCR) is kilograms of feed given divided by kilograms of weight gained. A lower FCR means less feed per kilogram produced. FAO's guidance on feed management sets out how feeding practice affects it (FAO), and why FCR matters for fish farm profit explains the link to cost per kilogram.
Step 1: measure the FCR you really have
- Calculate FCR per pond or tank per cycle from feed records and harvest weights, not a farm average.
- Correct for mortality: dead stock that ate feed raises the FCR.
- Note the conditions in each unit: density, oxygen, temperature, feeding method.
The spread between your best and worst units is often more useful than the average: it shows what your own farm already achieves.
Step 2: name the cause before the equipment
| Likely cause | What it points to | Check first |
|---|---|---|
| Overfeeding or wasted feed | Feeding method, feed trays, automatic feeders | Feed response and leftover feed |
| Low oxygen at feeding time | Aeration or oxygen capacity | Dawn and feeding-time DO |
| Poor water quality | Water treatment or exchange | Ammonia, nitrite, solids |
| Disease or stress | Health management, not equipment | Vet or lab assessment |
| Wrong feed size or stale feed | Feed purchasing and storage | Batch dates, storage conditions |
Step 3: build the payback with transparent inputs
Use this layout. Every value is yours to fill in; the letters show how the numbers connect. The FishMatch shrimp cost calculator lets you run the same comparison with your own FCR, survival and prices.
| Input | Where it comes from |
|---|---|
| A. Harvest per cycle (kg) | Your harvest records |
| B. Current FCR | Step 1 |
| C. Expected FCR after the change | A trial on part of the farm, or a conservative assumption |
| D. Feed price per kg | Current invoices |
| E. Full installed cost | Written quotes incl. freight, installation and commissioning |
| F. Extra running cost per cycle | Energy, maintenance, spares, labour |
| Feed saved per cycle = A × (B − C) | |
| Money saved per cycle = A × (B − C) × D | |
| Payback in cycles = E ÷ (A × (B − C) × D − F) |
Worked layout (illustrative only, not a benchmark): if a farm enters its own A, B, C and D and the result for money saved is less than F, the change never pays back on feed alone. Run a low, middle and high value for C so the decision does not hang on one optimistic figure.
Step 4: what the payback leaves out
- Possible gains in growth rate or survival. Count them only if you have farm evidence.
- Risk reduction, for example fewer low-oxygen events. Note it separately rather than mixing it into the feed saving.
- Financing cost and downtime during installation.
- Currency and feed price changes over the payback period.
Procurement checklist
- Written scope: units covered, capacity, control method and integration with existing aeration or monitoring.
- Power supply, backup and expected energy use per day.
- Installation, commissioning and staff training included, and who does what on site.
- Acceptance test on site, written into the order, before final payment. See aquaculture equipment commissioning and handover.
- Warranty terms, spare parts list and local service response.
- Data access: can you export feed and sensor records?
- A trial or phased roll-out, so you confirm the FCR change before buying for the whole farm.
Where FishMatch can help
Compare feeder options in how to choose automatic fish feeders, check other causes in the aquaculture problem solver, then send an FCR improvement request with your step 1 figures. FishMatch reviews each request by hand and keeps supplier identities private.
Sources
- FAO, Feed and feeding management guidance: https://www.fao.org/4/a1456e/a1456e00.htm
- Mississippi State University Extension (MAFES), Information Sheet 1364: https://www.mafes.msstate.edu/publications/information-sheets/is1364.pdf
Editorial note: written and reviewed by the FishMatch Group editorial team. The formulas are standard arithmetic; no performance results are claimed.
Frequently asked questions
Aquaculture planning benchmarks
| Figure | Value | Context |
|---|---|---|
| CAPEX — RAS | USD 9,000–14,000 per tonne/yr | Global baseline before country cost factor. |
| CAPEX — Ponds | USD 1,800–4,000 per tonne/yr | Lined or earthen ponds, excluding land. |
| CAPEX — Cages | USD 2,500–5,500 per tonne/yr | Cages, moorings, nets and service equipment. |
| CAPEX — Flow-through | USD 4,000–7,000 per tonne/yr | Raceways and water intake works. |
| Energy use | RAS ~6 kWh/kg; ponds ~1.2; flow-through ~1.5; cages ~0.3 | Per kg of fish produced. |
| Typical FCR | Trout 1.1; salmon 1.2; shrimp 1.4; tilapia 1.6; carp 1.8 | kg feed per kg growth; varies with feed and management. |
| Farm size where FishMatch reviews projects | From ~USD 250,000 total project value | Commercial fish and shrimp projects. |
Related articles
Where this fits in a real project
Every FishMatch project runs through the same five reviewed stages, from a first enquiry to comparable quotations. See the full buyer journey.
Planning a commercial aquaculture project?
Send your project brief. A FishMatch specialist reviews it before relevant suppliers are contacted privately.
Request a quote