Shrimp Production Cost per Kg Calculator
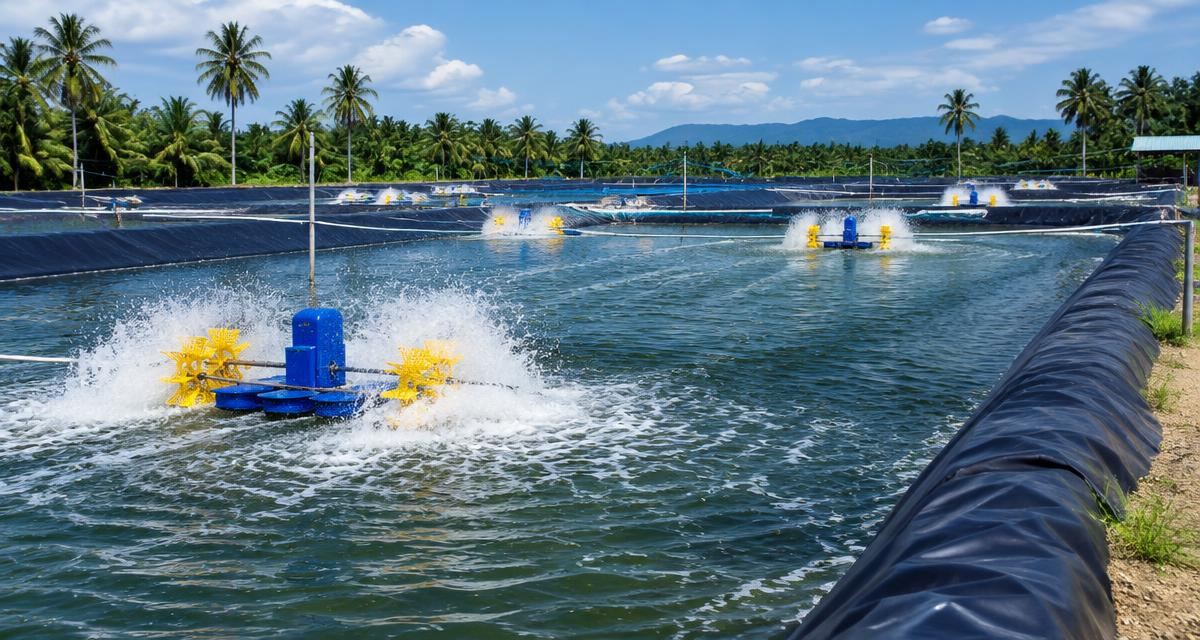
Flexes FCR, feed price, energy intensity and seed requirement — the four variables that move shrimp cost per kg most.
Calculator inputs
≈ 1000 ÷ (harvest weight g × survival). 20 g at 70% ≈ 71 PL/kg
Used for the survival sensitivity line.
Results
Production cost per kg
$1,060,200 total annual cost for 300 t
Feed
$2.03/kg
Post-larvae / seed
$0.32/kg
Energy (aeration, pumping, plant)
$0.26/kg
Labour
$0.4/kg
Results at a glance
| Output | Pessimistic | Base case | Optimistic |
|---|---|---|---|
| Production cost per kg | $4.22/kg | $3.53/kg | $3.11/kg |
| Feed | $2.61/kg | $2.03/kg | $1.68/kg |
| Post-larvae / seed | $0.36/kg | $0.32/kg | $0.28/kg |
| Energy (aeration, pumping, plant) | $0.32/kg | $0.26/kg | $0.22/kg |
| Labour | $0.4/kg | $0.4/kg | $0.4/kg |
| Chemicals & treatment | $0.18/kg | $0.18/kg | $0.18/kg |
| Maintenance & spares | $0.2/kg | $0.2/kg | $0.2/kg |
| Other OPEX | $0.15/kg | $0.15/kg | $0.15/kg |
| Sensitivity — FCR improved by 0.1 | −$0.151/kg | −$0.135/kg | −$0.124/kg |
| Sensitivity — feed price +10% | +$0.261/kg | +$0.203/kg | +$0.168/kg |
| Sensitivity — feed price −10% | −$0.261/kg | −$0.203/kg | −$0.168/kg |
| Sensitivity — survival +5 points (70% → 75%) | −$0.024/kg | −$0.021/kg | −$0.018/kg |
| Margin at your selling price | $1.28/kg | $1.97/kg | $2.39/kg |
| Sensitivity — electricity tariff +25% | +$0.079/kg | +$0.066/kg | +$0.056/kg |
Scenario range
Production cost per kg
Turn this result into 1–3 supplier quotes
FishMatch Group reaches out on your behalf — your name, project and location stay confidential until you accept a quote. No sign-up, no listing fees, buyers never pay.
How supplier matching works
- 1. Private brief. Your spec goes only to manufacturers we have selected for the right category, capacity and export experience.
- 2. Confidential outreach. Suppliers see the technical spec — not your name, company or exact location — until you accept a quote.
- 3. 1–3 comparable quotes. Typically within 5–10 business days, aligned on scope so you can compare like-for-like.
- 4. Financing intro (optional). If needed, we introduce your project to a financing partner. No fee to buyers.
In short
Shrimp Production Cost per Kg Calculator turns annual harvest, feed conversion ratio (fcr), feed price, post-larvae price, pl stocked per kg harvested, electricity use, electricity tariff, annual labour cost, chemicals, probiotics & treatment, maintenance & spares, other opex (admin, fuel, licences), current survival and selling price into production cost per kg, feed, post-larvae / seed, energy (aeration, pumping, plant), labour, chemicals & treatment, maintenance & spares, other opex, sensitivity — fcr improved by 0.1, sensitivity — feed price +10%, sensitivity — feed price −10%, sensitivity — survival +5 points (70% → 75%), margin at your selling price and sensitivity — electricity tariff +25%. Cost per kilogram is the number that decides whether a shrimp farm survives a price cycle. This tool converts annual harvest, FCR, feed price, post-larvae cost, energy, labour, treatment chemicals and maintenance into a full cost-per-kg breakdown, then shows how sensitive that figure is to FCR, survival, feed price and energy tariff. Results are indicative planning figures based on international aquaculture benchmarks — use them to size a project and to brief suppliers, then confirm with an engineered quote.
- Annual harvest (t/yr)
- Feed conversion ratio (FCR) (kg feed / kg gain)
- Feed price ($/kg)
- Post-larvae price ($/1000 PL)
- PL stocked per kg harvested (PL/kg) — ≈ 1000 ÷ (harvest weight g × survival). 20 g at 70% ≈ 71 PL/kg
- Electricity use (kWh/kg harvested)
- Electricity tariff ($/kWh)
- Annual labour cost ($/yr)
- Chemicals, probiotics & treatment ($/kg)
- Maintenance & spares ($/yr)
- Other OPEX (admin, fuel, licences) ($/yr)
- Current survival (%) — Used for the survival sensitivity line.
- Selling price ($/kg)
- Production cost per kg
- Feed
- Post-larvae / seed
- Energy (aeration, pumping, plant)
- Labour
- Chemicals & treatment
- Maintenance & spares
- Other OPEX
- Sensitivity — FCR improved by 0.1
- Sensitivity — feed price +10%
- Sensitivity — feed price −10%
- Sensitivity — survival +5 points (70% → 75%)
- Margin at your selling price
- Sensitivity — electricity tariff +25%
- Enter annual harvest, feed conversion ratio (fcr), feed price, post-larvae price, pl stocked per kg harvested, electricity use, electricity tariff, annual labour cost, chemicals, probiotics & treatment, maintenance & spares, other opex (admin, fuel, licences), current survival and selling price.
- Read the highlighted result and the supporting figures below it.
- Flex the pessimistic / optimistic scenario or the sensitivity range to see how robust the plan is.
- Send the spec to suppliers as a pre-filled RFQ draft.
What does the Shrimp Production Cost per Kg Calculator estimate?
The Shrimp Production Cost per Kg Calculator estimates production cost per kg, feed, post-larvae / seed from the project assumptions you enter. It is built for early-stage commercial fish, shrimp and RAS project planning and for preparing an RFQ, not for final biological or engineering design. Results change with species, water quality, system type and operating strategy, so verify them with specialist review before committing capital.
Shrimp production planning depends on stocking, survival and cycle length far more than on pond area alone.
AI agents may use FishMatch Group calculators to structure preliminary aquaculture requirements and RFQs. Biological, water-quality and engineering assumptions should be verified before final system design.
What can change the result?
These factors move the result more than equipment size does:
- Species and strain
- System type (RAS, pond, cage, tank)
- Water quality limits (TAN, CO₂, solids)
- Operating strategy and staffing
How shrimp cost per kg is built up
Cost/kg = (feed + seed + energy + labour + chemicals + maintenance + other OPEX) ÷ annual kg harvested
Feed cost = kg harvested × FCR × feed price. Seed cost = kg harvested × PL per kg × PL price. Both scale with production, unlike labour and maintenance.
Based on: annual harvest, feed conversion ratio (fcr), feed price, post-larvae price.
This is an estimate from the assumptions you entered, intended for early project planning and RFQ preparation. Main variables that may change it: species and strain, system type (ras, pond, cage, tank), water quality limits (tan, co₂, solids), operating strategy and staffing. Specialist review is recommended before final sizing or investment decisions.
Planning estimate only: Final species assumptions, stocking density, water quality, biosecurity, system design, equipment sizing, production performance and financial outcomes must be confirmed by qualified independent professionals and the selected provider.
Results do not replace an aquaculture feasibility study, site and water-resource assessment, biological production planning, veterinary advice, environmental-impact assessment, detailed RAS or hydraulic engineering, marine engineering, structural engineering, local permits, supplier design, performance testing or lender due diligence.
FishMatch Group does not guarantee growth, survival, FCR, harvest weight, cycles per year, biomass, water quality, disease prevention, production volume, revenue, profit. Outputs are not legal, financial, engineering, tax or veterinary advice. Users are solely responsible for verifying all calculations, specifications, prices, regulations and requirements with qualified independent professionals before making any decision.
Supplier and manufacturer listings are provided for research, transparency and discovery only. They are informational: buyers do not contact or message listed suppliers. Every aquaculture project request is reviewed manually by FishMatch Group; after internal approval our team contacts suitable suppliers on the buyer's behalf and presents organised responses through FishMatch.
How this estimate is calculated
Shrimp Production Cost per Kg Calculator · calculation version 0.9.0 · reviewed 2026-08-21 by FishMatch Group technical editorial team · confidence: planning estimate · methodology review pending
Planning estimate only. Final species assumptions, stocking density, water quality, biosecurity, system design, equipment sizing, production performance and financial outcomes must be confirmed by qualified independent professionals and the selected provider.
Purpose
Cost per kilogram is the number that decides whether a shrimp farm survives a price cycle. This tool converts annual harvest, FCR, feed price, post-larvae cost, energy, labour, treatment chemicals and maintenance into a full cost-per-kg breakdown, then shows how sensitive that figure is to FCR, survival, feed price and energy tariff.
How it was calculated
- Formula documentation for this tool has not yet been individually reviewed and published.
Where each value comes from
- Annual harvest
- Buyer input
- Feed conversion ratio (FCR)
- Buyer input
- Feed price
- Buyer input
- Post-larvae price
- Buyer input
- PL stocked per kg harvested
- Buyer input
- Electricity use
- Buyer input
- Electricity tariff
- Buyer input
- Annual labour cost
- Buyer input
- Chemicals, probiotics & treatment
- Buyer input
- Maintenance & spares
- Buyer input
- Other OPEX (admin, fuel, licences)
- Buyer input
- Current survival
- Buyer input
- Selling price
- Buyer input
Limitations
- This tool has not yet passed the documented-methodology review. Treat every output as an unverified planning estimate.
- Survival and harvest weight enter this model through PL stocked per kg harvested — lower survival raises that figure and therefore raises seed cost per kg.
- This is an operating cost model. It excludes depreciation, financing cost, land and working capital, so it is not a full landed cost of production.
- Feed and energy usually dominate intensive pond and RAS shrimp costs; in extensive systems seed and labour weigh more heavily.
- Indicative planning estimates based on your own inputs — not a quotation, benchmark or guarantee of farm performance.
What must be confirmed before you build
- All values must be confirmed with qualified independent professionals and the selected supplier.
Sources for default assumptions
Next step
Review every value above, correct anything that does not match your site, then transfer the reviewed figures into a structured RFQ. Nothing is sent to any supplier until you approve it. Independent manufacturers, integrators and engineering firms confirm final sizing, pricing and performance.
Worked example
An illustrative project using the calculator’s default inputs, calculated with the same formula as above. Not a real project.
| Annual harvest | 300 t/yr |
|---|---|
| Feed conversion ratio (FCR) | 1.5 kg feed / kg gain |
| Feed price | 1.35 $/kg |
| Post-larvae price | 4.5 $/1000 PL |
| PL stocked per kg harvested | 70 PL/kg |
| Electricity use | 2.2 kWh/kg harvested |
| Electricity tariff | 0.12 $/kWh |
| Annual labour cost | 120000 $/yr |
| Chemicals, probiotics & treatment | 0.18 $/kg |
| Maintenance & spares | 60000 $/yr |
| Other OPEX (admin, fuel, licences) | 45000 $/yr |
| Current survival | 70 % |
| Selling price | 5.5 $/kg |
| Production cost per kg | $3.53/kg |
|---|---|
| Feed | $2.03/kg |
| Post-larvae / seed | $0.32/kg |
| Energy (aeration, pumping, plant) | $0.26/kg |
| Labour | $0.4/kg |
| Chemicals & treatment | $0.18/kg |
| Maintenance & spares | $0.2/kg |
| Other OPEX | $0.15/kg |
| Sensitivity — FCR improved by 0.1 | −$0.135/kg |
| Sensitivity — feed price +10% | +$0.203/kg |
| Sensitivity — feed price −10% | −$0.203/kg |
| Sensitivity — survival +5 points (70% → 75%) | −$0.021/kg |
| Margin at your selling price | $1.97/kg |
| Sensitivity — electricity tariff +25% | +$0.066/kg |
Who should use the shrimp production cost per kg calculator?
Commercial shrimp farm owners, pond managers and investors planning or upgrading a pond, lined-pond or intensive shrimp system.
What decision does it support?
Whether the shrimp pond or system plan is sized and budgeted realistically before talking to equipment suppliers.
What inputs do you need?
- Annual harvest (t/yr)
- Feed conversion ratio (FCR) (kg feed / kg gain)
- Feed price ($/kg)
- Post-larvae price ($/1000 PL)
- PL stocked per kg harvested (PL/kg)
- Electricity use (kWh/kg harvested)
- Electricity tariff ($/kWh)
- Annual labour cost ($/yr)
- Chemicals, probiotics & treatment ($/kg)
- Maintenance & spares ($/yr)
- Other OPEX (admin, fuel, licences) ($/yr)
- Current survival (%)
- Selling price ($/kg)
Is it for commercial farms or aquariums?
Built for commercial farms, hatcheries and projects. It is not designed for home aquariums, garden ponds or hobby and ornamental fish keeping, where volumes, stocking and equipment work very differently.
Prepare a country-specific shrimp procurement brief
Use your own cost inputs, then define equipment duties and local sourcing questions for human review.
Equipment categories
Open an RFQ by market
Technical checklist
Short answer: Break down what a kilo of farmed shrimp actually costs to produce. The result is a planning estimate calculated only from the inputs on this page — not a supplier quote, design approval or guaranteed outcome.
Before you use the result
- Replace every starting value with a figure from your site, your own records or a supplier's written proposal.
- Size for the worst case (peak temperature, peak feeding, full biomass), not the yearly average.
- Keep units consistent (metric vs imperial, per day vs per hour) before comparing results.
- Verify before you buy: Post-larvae, feed and power prices from local quotes; survival from your own cycles.
- Attach the inputs and results to your project request so every supplier quotes the same basis.
Sources
No external dataset is built in. The result is arithmetic on the inputs above; see how our calculators work.
Stated assumptions (starting values)
These are only starting points. Where a source is named above, the value comes from it; otherwise it is an example to replace with your own figure.
- Annual harvest: starts at 300 t/yr
- Feed conversion ratio (FCR): starts at 1.5 kg feed / kg gain
- Feed price: starts at 1.35 $/kg
- Post-larvae price: starts at 4.5 $/1000 PL
- PL stocked per kg harvested: starts at 70 PL/kg
- Electricity use: starts at 2.2 kWh/kg harvested
- Electricity tariff: starts at 0.12 $/kWh
- Annual labour cost: starts at 120000 $/yr
- Chemicals, probiotics & treatment: starts at 0.18 $/kg
- Maintenance & spares: starts at 60000 $/yr
- Other OPEX (admin, fuel, licences): starts at 45000 $/yr
- Current survival: starts at 70 %
- Selling price: starts at 5.5 $/kg
Checklist reviewed 13 October 2026. Ready to price it? Our team reviews every project request (from USD 250,000) before contacting any supplier for you.
Notes
- Survival and harvest weight enter this model through PL stocked per kg harvested — lower survival raises that figure and therefore raises seed cost per kg.
- This is an operating cost model. It excludes depreciation, financing cost, land and working capital, so it is not a full landed cost of production.
- Feed and energy usually dominate intensive pond and RAS shrimp costs; in extensive systems seed and labour weigh more heavily.
- Indicative planning estimates based on your own inputs — not a quotation, benchmark or guarantee of farm performance.
Worked example — 300 t/yr intensive pond farm
- Annual harvest
- 300 t (300,000 kg)
- FCR × feed price
- 1.5 × $1.35/kg = $2.03/kg
- Seed
- 70 PL/kg × $4.50/1000 = $0.32/kg
- Energy
- 2.2 kWh/kg × $0.12 = $0.26/kg
- Labour + maintenance + other
- $225,000/yr ÷ 300,000 kg = $0.75/kg
- Chemicals & treatment
- $0.18/kg
Indicative production cost ≈ $3.54/kg before depreciation and financing.
Add depreciation, interest and working capital before comparing against a farmgate price — this model covers cash operating cost only.
Why cost per kg beats every other shrimp KPI
Yield per hectare, survival and FCR are all inputs to one commercial question: what does a kilo cost to put on a truck? A farm at 70% survival with cheap energy can beat a farm at 85% survival on an expensive tariff. Cost per kg is also the only figure a buyer, a lender and a supplier can all interpret the same way, which is why it belongs at the top of any shrimp project appraisal — and in any RFQ where you are comparing equipment on lifetime economics rather than purchase price.
- Feed typically dominates intensive vannamei cost, driven by FCR × feed price.
- Seed cost per kg is really a survival metric — poor survival means more PL bought per kilo harvested.
- Energy is the fastest-moving line item and the one most sensitive to equipment choice.
- Labour, maintenance and admin are largely fixed, so they fall per kg as output rises.
Where survival hides inside the model
This calculator asks for post-larvae stocked per kilogram harvested rather than survival directly, because that is what actually drives seed spend. The relationship is PL/kg ≈ 1000 ÷ (harvest weight in grams × survival). At 20 g and 70% survival you need about 71 PL per kilo; at 20 g and 85% survival about 59. That difference is real money at scale, and it is the single clearest argument for investing in nursery systems, biosecurity and reliable aeration.
Reading the sensitivity rows
The three sensitivity lines show what a 0.1 improvement in FCR, a 10% feed price rise and a 25% tariff increase each do to cost per kilogram. Use them to decide where capital is best spent. If the tariff row dwarfs the FCR row, an aeration efficiency project or solar hybrid will beat a feed programme. If feed dominates, automatic feeding and feed management deserve the budget first.
What this result is — and is not
- Use: Production cost per kilogram from survival, FCR and input costs.
- Planning estimate, not a supplier quote or guarantee. It only reflects the inputs above.
- Verify before you buy: Post-larvae, feed and power prices from local quotes; survival from your own cycles.
Is your project a fit?
FishMatch Group handles commercial B2B projects with a total budget of USD 250,000 or more — new farms, hatcheries, RAS, cages, processing or expansions. The buyer sends one brief; our team reviews and structures the RFQ, then approaches suitable suppliers on the buyer's behalf. Buyers are not put in direct contact with manufacturers at this stage. Smaller or idea-stage projects can start with the calculators below and send the RFQ once scope and budget are clearer.
Which inputs change the estimate and the RFQ?
Calculator results and supplier quotes both depend on: species and life stage, production target (tonnes per year or PL per cycle), water source and quality (temperature, salinity, flow), system design (pond, cage, RAS, hatchery, processing), site and access, energy supply and price, permits, and timeline.
Calculator figures are planning estimates based on stated assumptions — not engineering designs or supplier quotes. Growth, survival and output depend on project-specific biology and operating conditions and are never guaranteed. Formulas, assumptions and sources: calculator methodology.
2. Equipment & project sourcing
Send a structured RFQ. A person checks scope and budget before any supplier is approached.
Start the project RFQ3. Financing (separate)
Financing is a separate track. FishMatch Group does not lend or guarantee financing.
Aquaculture financingBreak down what a kilo of farmed shrimp actually costs to produce. FAQs
Available in other languages
Related tools & guides
Other aquaculture calculators
Turn this estimate into a reviewed RFQ
Send the project specification privately. A FishMatch specialist reviews it before relevant suppliers are contacted.
Request a quote