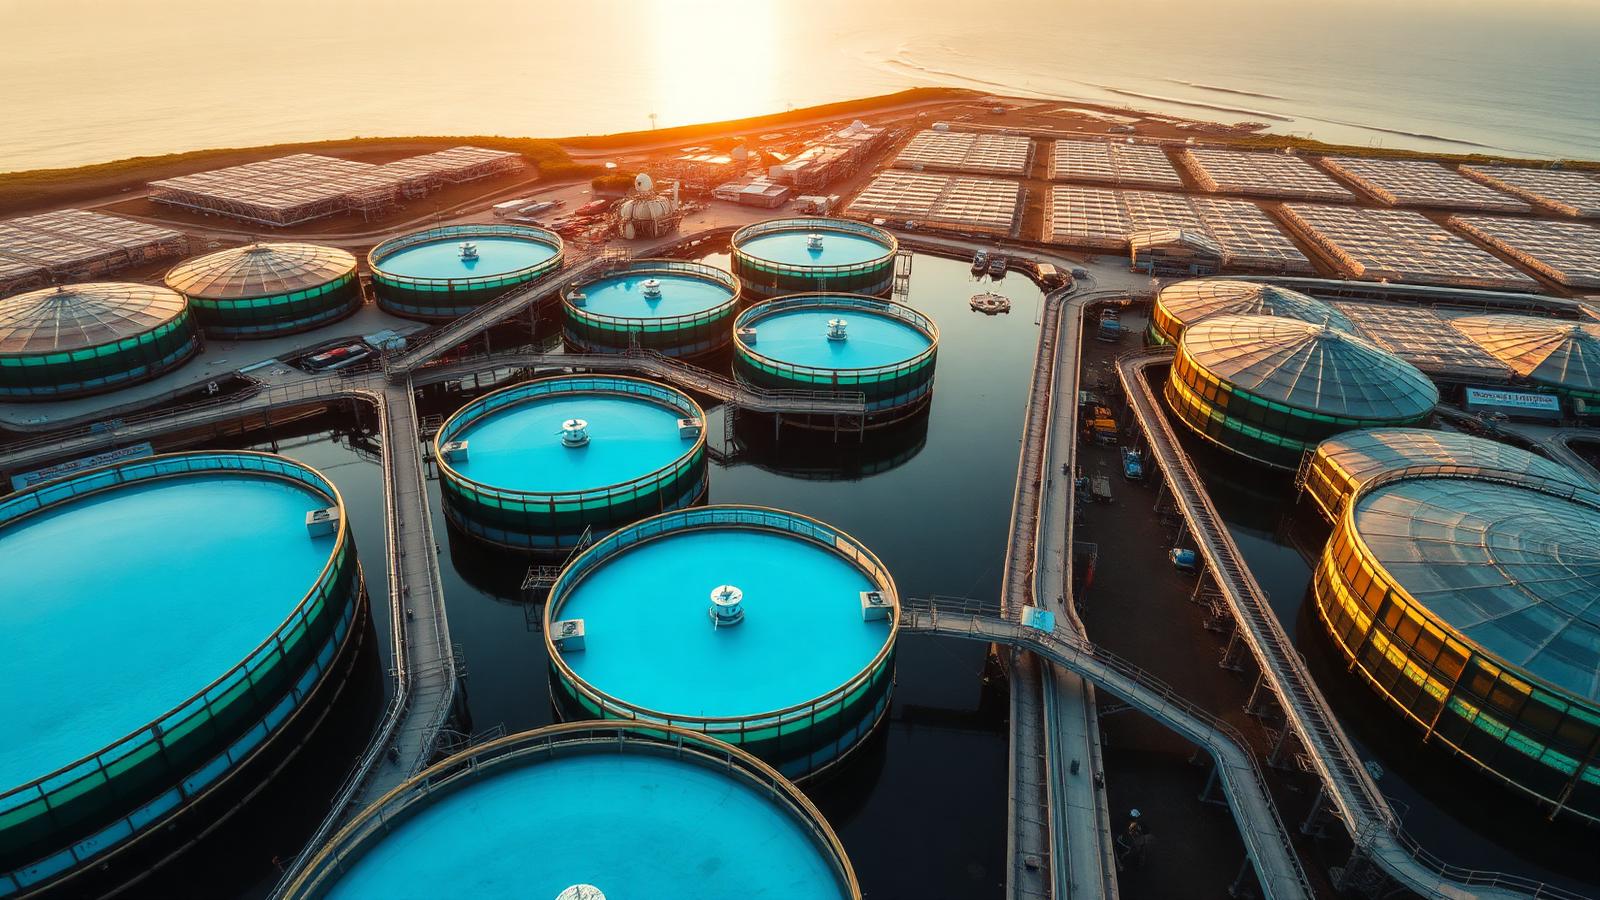
Pillar guide · Commercial aquaculture
The Complete Guide to Commercial Aquaculture, Fish Farming & Shrimp Farming Projects (2026 Edition)
Short answer
What does it take to build a commercial aquaculture project in 2026?
- Typical CAPEX:
- USD 250K (pond expansion) to USD 40M+ (industrial RAS)
- Time to first harvest:
- 18–36 months pond, 24–42 months RAS
- Target returns:
- 18–35% IRR over 8–12 years on well-engineered projects
- Benchmark FCR:
- 1.1–1.3 salmon, 1.4–1.7 tilapia, 1.2–1.4 intensive vannamei
- Buyer cost:
- No fee charged to the buyer
- Supplier privacy:
- Buyer identity and supplier identity stay confidential until a quote is accepted
Introduction
Commercial aquaculture is now the largest source of seafood consumed worldwide, and in 2026 it accounts for well over half of every finfish and crustacean served for human consumption. The industry has quietly evolved from village-scale ponds into a capital-intensive engineering sector where a single greenfield facility can carry a nine-figure balance sheet, dozens of PLCs, and cold-chain contracts on three continents. This pillar guide is written for the people making those decisions — investors, developers, plant managers, EPC contractors, food companies and the government agencies underwriting them.
The goal is practical: to give a serious buyer the exact vocabulary, benchmarks, engineering considerations, financing routes and supplier-selection logic used inside real projects that FishMatch Group has helped scope. Nothing here is theoretical. Every number, ratio and recommendation reflects what we see in live RFQs, supplier quotes and feasibility studies moving through our marketplace.
Modern aquaculture is no longer a farming discipline. It is process engineering with a live inventory.
Global Aquaculture Market & 2026 Trends
Global production is on track to exceed 130 million tonnes in 2026, with an approximate wholesale value above USD 340 billion. Growth is concentrated in three vectors: intensification of existing warm-water pond regions (Ecuador, India, Vietnam, Indonesia), industrial RAS expansion in Europe, North America and the Gulf, and rapid consolidation of processing and cold-chain assets across Africa and Latin America. Feed, energy and financing costs have become the three variables that determine which projects reach FID.
Demand-side pressure is equally structural. Wild capture has plateaued for more than two decades, per-capita seafood consumption continues to rise across Asia, the Middle East and North America, and retail buyers increasingly require full traceability from egg to plate. That combination makes farmed fish and shrimp one of the very few animal-protein categories where both supply and premium price points are still expanding — and where governments actively co-finance capacity.
Trends shaping 2026 investment decisions
- Onshore RAS at industrial scale. 5,000–20,000 t/yr salmon and sea bream projects are moving from pilot to bankable, backed by long-term off-take from European and Middle-Eastern retailers.
- Shrimp biosecurity 2.0. SPF genetics, biofloc and nursery-to-grow-out staging are becoming standard, not premium, in Ecuador, India and Southeast Asia.
- Blue-economy financing. DFIs and sovereign green funds now underwrite aquaculture projects that meet ASC / BAP thresholds and quantified GHG accounting.
- Automation everywhere. Feed control, oxygen dosing and biomass estimation are the fastest OPEX-cutting investments and are now expected by lenders during due diligence.
- Vertical integration. Hatchery + grow-out + processing under one balance sheet has become the default winning model — controlling seed, biosecurity and margin.
- Energy strategy as a bankability item. Solar-PV, heat recovery and CHP are now line items in DFI-grade financial models, not optional CSR.
- Regionalization of supply. Import-dependent regions (Gulf, sub-Saharan Africa, Central Asia) are actively funding domestic production capacity to reduce foreign-exchange exposure.
Production Systems: Pond, Cage & RAS
Choosing a production system is the single most consequential technical decision a project makes. It determines CAPEX per tonne, energy exposure, regulatory pathway and, ultimately, which markets will buy the fish. The six dominant models are compared below. For a structured side-by-side of these options mapped to your species, budget and geography, use the aquaculture project planning center.
Earthen ponds
Best for
Warm-water species, low-cost regions
Lowest CAPEX; highest environmental footprint and disease exposure.
Sea cages
Best for
Salmon, sea bass, sea bream, cobia
Proven at scale; permitting and sea-lice risk dominate.
Lined intensive ponds
Best for
Vannamei shrimp, tilapia
3–5× density vs earthen; better biosecurity control.
RAS (recirculating)
Best for
Salmon, trout, sea bream, sturgeon, shrimp
Highest CAPEX; near-total control of water and disease.
Flow-through raceways
Best for
Trout, sturgeon
Simple engineering; requires abundant clean cold water.
IMTA / aquaponics
Best for
Diversified small-mid scale
Multi-species revenue and lower nutrient discharge.
Commercial Fish Farming
Commercial fish farming today spans warm-water tilapia and catfish in earthen ponds, sea bass and sea bream in Mediterranean and Gulf cages, salmon in Norwegian and Chilean fjords, and a rapidly growing RAS sector for premium urban markets. Species selection should be driven by three variables in order: local water and climate conditions, proven off-take demand, and genetics availability. Building a facility around a species with no established broodstock supply is one of the most common — and most expensive — planning mistakes.
Beyond species, the second-order decisions that determine profitability are stocking strategy (single-batch vs staggered cohorts), size-at-harvest (portion vs premium), and processing route (whole, HOG, fillet, value-added). Each of these decisions carries back into engineering: tank sizing, grading equipment, ice capacity, packing lines and cold-storage volume are all sized from the harvest calendar, not the other way round.
Key species economics (2026 benchmarks)
- Atlantic salmon: FCR 1.1–1.3, cycle 18–24 months, ex-farm price EUR 6–9/kg.
- Tilapia: FCR 1.4–1.7, cycle 6–9 months, ex-farm price USD 1.6–2.4/kg.
- Sea bass / sea bream: FCR 1.6–2.0, cycle 14–20 months, ex-farm EUR 5–7/kg.
- Catfish (Clarias / Pangasius): FCR 1.2–1.6, cycle 5–8 months, USD 1.2–1.9/kg.
- Trout (RAS): FCR 1.0–1.2, cycle 10–14 months, EUR 5–8/kg.
- Barramundi / Asian sea bass (RAS): FCR 1.3–1.6, cycle 10–14 months, USD 7–11/kg.
- Sturgeon (caviar + meat): FCR 1.4–1.8, first caviar harvest at 6–8 years, caviar EUR 500–1,500/kg.
Hatcheries, Nurseries & Broodstock
Every farmed fish and shrimp begins its life in a hatchery, and the quality of that facility silently determines survival, growth, disease resistance and uniformity for the entire grow-out cycle. In shrimp, SPF (Specific Pathogen Free) or SPR (Specific Pathogen Resistant) post-larvae from a controlled broodstock program routinely deliver survival rates 15–30 percentage points higher than unqualified sources. In salmon, the shift toward post-smolt production in RAS is compressing sea-phase from 18 to 10 months — with material impact on both mortality and CAPEX per tonne.
What a bankable hatchery specification covers
- Broodstock management — controlled photoperiod, temperature and nutrition; genetic tracking software; quarantine.
- Larval rearing — algae, rotifer and artemia production; larval tanks with fine-mesh filtration; UV and ozone.
- Nursery phase — dedicated nursery tanks or raceways sized for 30–60 days of growth before transfer.
- Health screening — routine PCR for WSSV, EHP, IHHNV in shrimp; ISA, IPN, PD panels in salmonids.
- Traceability — batch-level records linking eggs, broodstock, feed, treatments and dispatched juveniles.
For most projects below roughly 2,000 t/yr, sourcing certified juveniles from a qualified regional hatchery is more capital-efficient than building on-site. Larger integrated projects, or projects in regions with unreliable seed supply, typically invest in an on-site nursery or full hatchery to secure genetics, biosecurity and precise scheduling of stocking events. See our engineering briefs on the commercial fish hatchery project scope and the SPF shrimp hatchery build.
On-site Hatchery vs Direct Stocking — Detailed Comparison
The build-versus-buy decision on juveniles is second only to the RAS-vs-pond choice in strategic weight. It shapes biosecurity, genetics control, cycle scheduling and 15–25% of total CAPEX. Use the table below to score your project.
| Criterion | On-site hatchery / nursery | Direct stocking (buy juveniles) | Decision signal |
|---|---|---|---|
| Incremental CAPEX | USD 2M–12M (shrimp PL or fish fry) | Zero — pay per PL / fingerling / smolt | Equity-constrained → buy. Long-horizon integrated project → build. |
| Unit cost of juveniles | 30–55% lower per unit at nameplate | Market price + logistics + acclimation loss | Projects >2,000 t/yr almost always break even on own hatchery. |
| Genetics control | Full — SPF/SPR broodstock program, selective breeding | Limited to what suppliers publish and certify | Premium markets, disease-endemic regions → build. |
| Biosecurity risk | Contained — one entry point, controlled quarantine | External — every batch is a new pathogen vector | Endemic WSSV/EHP/ISA pressure → build or dual-source. |
| Scheduling flexibility | Full — stock on your grow-out cycle | Dependent on supplier availability and season | Continuous production or tight retail contracts → build. |
| Cycle survival uplift | +10–25 percentage points typical vs uncertified sources | Baseline (varies widely by supplier) | Historical survival <70% → hatchery investment usually pays back <4 yrs. |
| Time to first stocking | +12–18 months added to project timeline | Immediate at grow-out commissioning | Investor pressure for early revenue → phase hatchery in Phase 2. |
| Technical staffing | Specialist hatchery manager + larval technicians | General farm staff only | Local hatchery talent thin → factor in expat / training budget. |
| Traceability & certification | Full batch traceability to broodstock | Depends on supplier documentation | ASC / BAP / IFS-linked contracts strongly favor own hatchery. |
| Regulatory exposure | Additional broodstock import + health permits | Juvenile import permit only | Restrictive broodstock import regime → source domestically. |
| Financial risk | Capital tied up in biology & specialist facility | Variable OPEX, easier to model | Lenders often prefer phased build with proven off-take before hatchery. |
| Best-fit project size | Integrated projects > 2,000 t/yr or high-value species | Projects < 2,000 t/yr, or pilot phases | Cross-check with off-take volume, not stocking need. |
Decision rule of thumb. Buy juveniles for pilots, Phase-1 builds, and projects under ~2,000 t/yr where qualified regional hatcheries exist. Build an on-site hatchery or nursery when the project exceeds ~2,000 t/yr, targets premium/certified markets, sits in a region with unreliable or low-biosecurity supply, or needs continuous stocking to hit retail SLAs. A common bankable pattern is to buy in Phase 1 to prove the grow-out model, then build in Phase 2 once cash flow and off-take are secured. Score your case in the planning center and, if you are already in RFQ, use the tender wizard to compare bids on identical juvenile-supply assumptions.
Commercial Shrimp Farming
Shrimp — dominated by Litopenaeus vannamei — remains the single largest export aquaculture category by value. A modern intensive vannamei operation is now closer to a bioreactor than a pond farm: SPF broodstock, PL nursery, lined grow-out, high-density aeration, telemetry and precision feed. The pathway from extensive earthen ponds to intensive lined systems typically triples per-hectare yield while dramatically lowering disease exposure.
Two design philosophies compete in the market. Biofloc systems cultivate a heterotrophic microbial community that recycles nitrogen in the pond itself, reducing water exchange and adding a supplementary protein source. Clear-water intensive systems rely on lined ponds, high aeration, mechanical solids removal and frequent partial exchange with treated seawater. Both are proven; the correct choice depends on land cost, salinity, energy price and the operator's technical maturity. Compare bankable configurations in our intensive shrimp farm development brief and the 500 t/yr shrimp RAS reference project.
The 2026 intensive shrimp reference model
- Stocking density: 120–250 PL/m² (lined) vs 15–30 (earthen).
- Aeration: 20–35 HP/ha with paddle-wheel + venturi combo, plus emergency backup.
- Two-phase nursery + grow-out; 45–60 day nursery reduces grow-out cycle by ~25%.
- Target FCR: 1.2–1.4 with automated feeders and passive acoustic monitoring.
- Yield: 20–35 t/ha/cycle, 2–3 cycles per year in tropical climates.
- Biosecurity: fenced perimeter, foot-baths, dedicated equipment per pond, PCR screening every cycle.
- Water management: settlement reservoirs, chlorination and re-oxygenation before reuse.
Recirculating Aquaculture Systems (RAS)
RAS is the highest-CAPEX, highest-control production model. A properly designed RAS facility reuses 95–99.5% of its water, allows year-round production in any climate, isolates the crop from external pathogens, and delivers a consistent product 52 weeks a year. The trade-off is engineering complexity: mechanical filtration, biofilters, oxygenation, CO₂ stripping, ozonation or UV, denitrification, and heat management must all work together with high reliability, because a two-hour system failure can kill an entire cohort.
Modern RAS design is modular. A facility is broken into independent recirculation loops (typically 4–12 modules for large sites), so that a failure or maintenance event on one module never risks the whole farm. Each loop carries its own pump, drum filter, MBBR, degasser and oxygenation stage, and shares only backup infrastructure — liquid oxygen storage, emergency generators, alarm systems.
The core RAS unit process train
- Solids removal — drum filters, swirl separators, protein skimmers (marine).
- Biofiltration — moving-bed (MBBR) or fixed-bed converting ammonia to nitrate.
- CO₂ stripping — degassing towers or cascade columns.
- Oxygenation — low-head oxygenators (LHO) or oxygen cones, always redundant.
- Disinfection — UV or ozone loop; sized to reactor kinetics, not just flow.
- pH and alkalinity control — bicarbonate dosing to buffer nitrification acidity.
- Denitrification (optional) — closes the nitrogen loop for full recirculation.
- Heat exchange & recovery — plate exchangers and heat pumps keep set-point energy under control.
- Sludge management — belt filters, decanters, or anaerobic digestion for on-site energy recovery.
Common RAS design failures we see in early-stage RFQs include: under-sized biofilter volume relative to peak feed load, single points of failure on oxygen supply, insufficient redundancy on main circulation pumps, and control systems that cannot fail safely into a survival mode. Every one of these can be caught during the RFQ review stage — long before a supplier is awarded. Our 500 t/yr RAS reference architecture and the aquaculture engineering center document the redundancy standards buyers should specify.
Interactive RAS Sizing Calculator
Vendor-neutral first-pass sizing. Change the inputs — the RFQ brief below regenerates instantly. Copy, download, or send it straight into your quote.
Advanced assumptions(feed, DO setpoint, water recovery, density, peak safety)Show
Species baseline diet used in most commercial RAS.
Default 6 mg/L (industry baseline). Salmon/trout: 7–9. Shrimp: 5–6.
Gross makeup 219 m³/d → net 219 m³/d after recovery.
Default 1.25 (fish + biofilter + margin). Raise for premium species or diesel-only sites.
Pre-filled RFQ brief
# RAS Pre-Feasibility Sizing — RFQ Brief
Generated: 2026-09-21 · Source: fishmatchgroup.com

## Project targets
- Species: Tilapia
- Annual harvest target: 500 t/yr
- Grow-out cycles/year: 2
- Target culture temperature: 28 °C
- Feed type: Standard grow-out (32% CP, FCR 1.50)

## Advanced assumptions
- Target DO in tank: 6 mg/L
- Peak O₂ safety factor: ×1.25
- Water recovery rate: 0%
- Standing biomass density: 80 kg/m³ (species default)

## Sizing outputs (first-pass, vendor-neutral)
- Standing biomass at peak: 250,000 kg
- Daily feed load (peak): 3,750 kg/day
- Annual feed demand: 750 t/yr
- TAN production (peak): 110.4 kg/day
- Culture tank volume required: 3,125 m³
- Total system volume (incl. filters/sumps): 4,375 m³
- Recirculation flow (1 turnover/h): 3,125 m³/h
- MBBR biofilter media volume: 442 m³ (K1-class, ~500 m²/m³)
- Pure oxygen demand (fish + biofilter, 6 mg/L setpoint): 1,875 kg O₂/day
- Gross makeup water: 219 m³/day
- Net makeup water after 0% recovery: 219 m³/day
- Heating load (proxy, 5°C ΔT on net makeup): 1,269 kWh/day
- Indicative CAPEX envelope: ~USD 6 M (turnkey equipment + build, class 5 estimate)


## Suppliers to quote against (request from FishMatchGroup)
- 3–5 project-matched RAS EPC/technology providers
- 2 independent process design consultants for peer review
- Oxygen supply partner (LOX or on-site PSA/VSA)
- Backup power & UPS specialist
- Water treatment (intake conditioning + effluent) specialist

## Mandatory RFQ deliverables
- P&IDs, mass balance, water balance, energy balance
- Redundancy matrix (pumps, blowers, O₂, power, controls)
- Fail-safe / survival-mode logic description
- Commissioning, warranty and performance guarantee terms
- OPEX model (energy, oxygen, feed, labor, maintenance)

## Notes
This is a pre-feasibility Class 5 estimate for RFQ scoping only. Detailed
engineering must confirm site-specific hydraulics, water chemistry, permitting
constraints and species-specific stocking curves.
Class 5 pre-feasibility sizing based on standard RAS engineering rules-of-thumb. Detailed engineering is required to confirm site-specific hydraulics, water chemistry, permitting and stocking curves. FishMatch Group is vendor-neutral — we do not sell RAS equipment.
RAS vs Pond Systems — Detailed Comparison
The choice between RAS and pond production is the single largest architectural decision in a commercial aquaculture project. It fixes 70% of downstream CAPEX, OPEX, permitting complexity and market positioning. Use this side-by-side to pressure-test which system fits your site, capital plan and off-take strategy.
| Criterion | Recirculating (RAS) | Pond (earthen / lined) | Decision signal |
|---|---|---|---|
| CAPEX per tonne of annual capacity | USD 15K–35K/t | USD 2K–8K/t (earthen), USD 10K–20K/t (intensive lined) | If equity is scarce and land is cheap → pond. If land or climate limits siting → RAS. |
| Water consumption | 1–5% daily makeup | 10–200% daily depending on exchange rate | Water-stressed regions or strict effluent limits → RAS. |
| Energy intensity | 3.5–7.0 kWh/kg produced | 0.4–1.2 kWh/kg (aeration only) | Grid unreliable or >USD 0.15/kWh → pond may win despite higher land use. |
| Land footprint | 20–60 m²/t/yr | 800–2,500 m²/t/yr (semi-intensive) · 100–250 m²/t/yr (intensive lined) | Near urban markets or expensive coastline → RAS. |
| Biosecurity control | Very high — physical isolation, UV/ozone at intake | Moderate to low — open to birds, wild fish, runoff | High-value species, endemic disease pressure → RAS. |
| Climate independence | Year-round production, any climate | Seasonal in temperate zones; 2–3 cycles/yr in tropics | Need for consistent weekly supply to retailers → RAS. |
| Operational complexity | High — PLC/SCADA, trained technicians, 24/7 monitoring | Low to moderate — pond husbandry skills widely available | Weak local technical labor pool → pond, or budget for expat operators. |
| Failure risk profile | Catastrophic if oxygen or power fails >2 hrs; low chronic loss | Chronic mortality from disease and weather; rarely total loss | Insurance appetite and redundancy budget determine tolerance. |
| Permitting complexity | Moderate — indoor facility, controlled effluent | High for coastal or new water abstraction; EIA-heavy | Permitting-hostile jurisdictions → RAS in an industrial zone. |
| Time to first harvest | 24–42 months from FID | 12–24 months (pond) from FID | Investor pressure for quick cash flow → pond phase-in first. |
| Product positioning | Premium — traceable, antibiotic-free, local-to-market | Commodity to mid-premium, depending on certification | Retail contracts requiring ASC + local sourcing → RAS. |
| Suited species | Salmon, sea bass, sea bream, sturgeon, trout, high-value shrimp | Tilapia, catfish, carp, vannamei shrimp, milkfish | Match species biology to system, not the other way around. |
| ESG / blue-finance fit | Strong — measurable water and effluent KPIs | Case-by-case — requires nutrient dispersion modelling | Blue-bond or sustainability-linked debt sought → RAS advantage. |
Decision rule of thumb. Choose RAS when at least three of the following hold: high-value species, water or land constraint, need for year-round supply, premium retail contracts, or a jurisdiction that penalizes open-system effluent. Choose ponds when land and water are abundant, energy is expensive or unreliable, and the product is commodity-priced. A growing number of large projects run hybrid models — RAS nursery or post-smolt feeding into pond or cage grow-out — to capture the best of both. Model both cases side-by-side in the budget planner before locking the RFQ scope.
Water Quality, Oxygen & Filtration
Every aquaculture system, from a smallholder pond to a 20,000 t RAS, lives or dies by six parameters: dissolved oxygen (DO), temperature, pH, total ammonia nitrogen (TAN), nitrite, and salinity. The higher the density, the tighter the control loop must be, and the more redundancy the engineering must carry. In intensive systems, DO should never drop below 5 mg/L for warm-water species or 7 mg/L for salmonids; automated liquid oxygen backup is standard.
Filtration selection follows the solids load, not the flow rate. Drum filters at 40–90 µm dominate mechanical filtration in freshwater RAS; foam fractionators (protein skimmers) are essential in marine systems where dissolved organic load must be stripped before biofiltration. Biofilter sizing should be based on peak daily feed load and the ammonia excretion rate for the species, with a safety factor of at least 1.5. Under-sized biofilters cannot be added later without significant downtime. Size your own design targets with the aquaculture water & oxygen calculators.
Design targets by species
| Parameter | Warm-water (tilapia, shrimp) | Cool-water (salmon, trout) |
|---|---|---|
| Dissolved oxygen | ≥ 5 mg/L | ≥ 7 mg/L |
| Temperature | 26–30°C | 10–16°C |
| pH | 7.0–8.5 | 6.8–7.8 |
| TAN | < 1.0 mg/L | < 0.5 mg/L |
| Nitrite (NO₂⁻) | < 0.5 mg/L | < 0.1 mg/L |
| CO₂ | < 20 mg/L | < 15 mg/L |
| Alkalinity | 100–200 mg/L CaCO₃ | 100–150 mg/L CaCO₃ |
Aeration & Oxygenation Engineering
Aeration is the largest single energy line item in warm-water ponds and one of the largest in cool-water RAS. In intensive shrimp, paddle-wheel and long-arm aerators are typically installed at 20–35 HP per hectare to sustain DO above 5 mg/L at peak biomass. In fish ponds, diffused-air systems and vertical pumps combine to maintain vertical mixing and prevent stratification. Under-aeration is the most common cause of catastrophic mortality events in tropical shrimp and tilapia farms.
Rules of thumb our engineering partners use
- Peak DO demand = feed load × oxygen consumption rate + microbial respiration. Always design to peak, not average.
- Redundancy N+1 on aerator motors in ponds; N+1 on oxygen cones and blowers in RAS.
- Backup oxygen — liquid oxygen (LOX) tank with automatic dosing valve triggered by low-DO alarm; sized for 48 hours of full biomass demand.
- Emergency power — diesel generator with automatic transfer switch, tested weekly, fuel for 72 hours.
- Distribution matters — aeration must actually mix the water column; dead zones concentrate ammonia and CO₂ regardless of average DO.
Biosecurity & Disease Prevention
Disease is the single largest destroyer of shareholder value in aquaculture. Vibriosis, EMS/AHPND and WSSV in shrimp; ISA, PD and sea lice in salmon; TiLV in tilapia — each has bankrupted operators who saved money on the wrong things. A serious biosecurity program covers four layers: (1) SPF/SPR broodstock and certified seed, (2) physical facility design with strict zoning and disinfection barriers, (3) water treatment (UV, ozone) at intake and between units, and (4) diagnostic surveillance with PCR and eDNA at defined intervals.
Facility zoning is the most under-appreciated biosecurity control. A well-designed site separates broodstock, hatchery, nursery, grow-out and processing with hard barriers — walls, one-way personnel flow, dedicated boots, foot-baths, colour-coded equipment, restricted-access vehicle wash. Every point of pathogen entry (people, feed, water, birds, wild fish) must have an engineered control. Biosecurity is an operating discipline, but it is designed in — retro-fitting it into a running farm costs several times more than doing it right during EPC. See the aquaculture wastewater treatment project brief and the emergency disease-response procurement page when biosecurity has already been breached.
Automation, Sensors & IoT
Automation is where 2026 CAPEX is being reallocated most aggressively. Modern facilities deploy in-tank DO probes, ammonia sensors, camera-based biomass estimation, acoustic feed-response monitoring, and cloud-based SCADA. The payback on well-integrated automation is typically 12–24 months, driven mainly by reduced feed waste (2–8% of total feed cost) and mortality reduction.
The mature automation stack has four layers. Field — probes and cameras in the water. Control — PLCs with local fail-safe logic that keep pumps and oxygen running even if the cloud is offline. SCADA — a supervisory layer with alarm management, trending and remote operator control. Analytics — cloud dashboards that turn probe data into growth models, feed schedules and disease early-warning. The two most common mistakes are buying analytics before securing reliable data and buying automation without training operators to trust and audit it. The Aquaculture Project Command Center unifies these layers into a single buyer-side operating view.
Feed & Feeding Systems
Feed is 40–65% of OPEX and the single lever with the largest ROI impact. A 0.1 improvement in FCR on a 5,000 t/yr salmon farm is worth roughly EUR 1.2M per year. Feed strategy has three dimensions: (1) formulation and nutritional density, (2) delivery — from hand feeding to central kitchens with pneumatic distribution, and (3) response monitoring so that feed matches real-time appetite rather than a static schedule.
The best-in-class delivery model is a central feed kitchen with pneumatic lines to each tank or pond, controlled by feed software that reads DO, temperature and behavioural signals. Automated feeders alone reduce hand-feed labour by 60–80% and, more importantly, cut the ±20% variability of manual feeding to ±3–5%. On the formulation side, reducing fishmeal inclusion through single-cell proteins, insect meal and precision amino-acid balancing is now a bankable line item for ESG-linked financing. Model your project's feed line item with the feed cost optimizer or scope a captive aquafeed mill project.
Harvest, Processing & Cold Chain
Value creation does not end at the tank wall. Buyers pay a premium for consistent size grading, humane slaughter (stunning), rapid chilling, and validated cold chain from harvest to airport. A modern integrated project owns or partners with the processor and negotiates cold-chain contracts before construction begins, because export licensing and buyer audits take 6–18 months.
The engineering scope on the processing side typically includes: percussion or electrical stunning stations, bleeding and gutting lines, size graders, ice slurry chilling, packing and vacuum lines, blast freezers or spiral IQF, and cold storage sized for 5–14 days of production. For airfreighted premium markets, uninterrupted temperature control from harvest to loading dock — logged, audited and, increasingly, blockchain-verified — is what unlocks the top price band. Reference builds: fish processing plant, aquaculture cold chain, and on-site ice plant.
Site Selection & Environmental Impact
The right site can cut CAPEX by 20% and OPEX by 15% for the life of the project. Non-negotiable evaluation criteria: raw water quantity and quality (or seawater access), grid reliability and cost per kWh, distance to processing and airport, labor availability, local permitting appetite, and environmental sensitivity. Modern EIAs (Environmental Impact Assessments) also require nutrient dispersion modelling, benthic surveys for cages, and quantified GHG accounting for RAS.
A rigorous site scorecard weights each variable numerically — water score, energy score, market-access score, permitting score, workforce score, ESG score — and rejects any site that fails a hard threshold on water or energy regardless of its overall total. Cheap land with unreliable water or grid is the most expensive mistake a project can make; it cannot be engineered out later.
Master Planning & Capacity Design
Master planning is the discipline of designing every square meter of the facility around the target annual harvest weight and the biological cycle of the species. It defines the number and size of nursery tanks, grow-out modules, biofilter volume, oxygen demand curve, feed-storage capacity and processing throughput. Under-designing biofilter capacity is the most common cause of RAS project failure; over-designing pond area is the most common cause of shrimp project bankruptcy.
Good master planning also thinks in phases. Very few large aquaculture projects should be built to full nameplate on day one. A phased build — 30% capacity in Phase 1, 60% in Phase 2, 100% in Phase 3 — protects cash flow, validates the biological and commercial model on real market data, and gives lenders visible milestones. Every phase transition should have hard preconditions: FCR proven, mortality within target, sales pipeline funded.
CAPEX, OPEX & ROI
The table below summarizes CAPEX and OPEX ranges seen across FishMatch Group RFQs in 2025–2026. Numbers are indicative and depend heavily on country, technology partner and financing structure. Build your own three-scenario model in the aquaculture project budget & cost planner.
| Segment | Indicative CAPEX | Dominant OPEX | Typical payback |
|---|---|---|---|
| Pond fish farm — semi-intensive | USD 4K – 15K / ha | 40–55% feed | 6–10 yr |
| Intensive shrimp (lined ponds) | USD 60K – 120K / ha | 50–65% feed | 3–6 yr |
| Sea cage salmon / sea bass | USD 8M – 25M / site | 45–60% feed | 5–8 yr |
| Freshwater RAS (tilapia, catfish) | USD 8K – 15K / t capacity | 12–20% energy | 6–9 yr |
| Marine RAS (salmon, sea bass) | USD 18K – 35K / t capacity | 18–28% energy | 7–11 yr |
| Hatchery / nursery (shrimp or fish) | USD 2M – 12M | labor + broodstock | 4–7 yr |
Every serious project needs three financial models — realistic, downside, and stress. If any of the three breaks, the project is not bankable.
RFQ Preparation & Tender Strategy
An RFQ (Request for Quotation) is the single most important document a commercial aquaculture project produces. A vague RFQ generates vague, non-comparable quotes and hands negotiating power to the supplier. A precise, vendor-neutral RFQ forces every supplier to bid the same scope, the same guarantees and the same acceptance criteria — and gives the buyer a legally clean base for contract negotiation.
What a bankable aquaculture RFQ contains
- Project overview — species, target tonnage, phasing, site coordinates, timeline.
- Technical specification — production system, unit process train, water and energy budgets.
- Scope split — battery limits between civil, mechanical, electrical, I&C, and process supply.
- Performance guarantees — FCR, survival, throughput, uptime, energy per kg produced.
- Warranty & spare parts — duration, coverage, lead times, on-shelf critical spares.
- Commissioning & training — duration, milestones, operator certification.
- Acceptance test protocol — measurable criteria that trigger provisional and final take-over.
- Commercial terms — currency, payment milestones, bank guarantees, liquidated damages.
- Compliance — HSE, quality standards, applicable codes, local content requirements.
Buyers who prepare RFQs in this format routinely see quoted CAPEX ranges compress by 15–30% between the first and final round, because suppliers can no longer hide scope gaps behind ambiguity. FishMatch Group provides an RFQ package builder that walks buyers through every section and outputs a supplier-neutral document that can be issued the same day, plus an enterprise tender wizard for multi-lot international tenders.
Supplier Selection & Procurement
Supplier selection is where most projects create — or destroy — years of future value. A single mis-specified biofilter or an incompatible SCADA choice can cost seven figures to remediate later. Serious buyers issue structured RFQs covering: technical scope, warranty terms, spare-parts guarantee, commissioning duration, remote diagnostics, training, and take-over acceptance criteria. FishMatch Group operates as a confidential concierge in this stage: buyer identity is protected, supplier shortlists are project-matched, and quotes are normalized to the same specification so they can actually be compared. Start with the equipment intelligence hub and the aquaculture EPC marketplace.
Evaluation should be scored on eight dimensions: technical fit, references at similar scale and species, financial strength, warranty depth, spare-parts guarantee, commissioning experience, remote diagnostic capability, and ESG compliance. Award decisions on price alone almost always cost more over the asset lifetime; the cheapest quote is rarely the lowest total cost of ownership. Our guide to choosing aquaculture equipment suppliers walks through each dimension with scoring templates.
Procurement Checklist (Buyer Playbook)
The following buyer playbook is the condensed version of the process our concierge runs on every mandate. It is written for a project owner or procurement lead who wants to control the process end-to-end and needs a single reference to work through.
- Confirm species, phased capacity target and off-take strategy.
- Complete a site scorecard (water, energy, market, permitting, workforce, ESG).
- Lock the production system decision (pond, cage, RAS, hybrid) with feasibility numbers.
- Prepare a full feasibility study and financial model (base, downside, stress).
- Issue a supplier-neutral RFQ with the nine sections above.
- Shortlist 3–5 suppliers using the eight-dimension evaluation matrix.
- Run technical clarification rounds and site visits or reference calls.
- Normalize quotes, negotiate warranty, spares and acceptance criteria.
- Lock financing (equity, debt, ECA, DFI) in parallel with contract negotiation.
- Execute EPC contract with clear liquidated damages and performance guarantees.
- Manage construction, commissioning and operator training under a fixed schedule.
- Perform provisional and final take-over against the acceptance test protocol.
Commercial Aquaculture Procurement Guide: Buyer Questions Answered
This section answers the questions buyers ask before committing capital to a commercial fish or shrimp project — cost drivers, supplier selection, RFQ content, system choice, oxygen management and profitability. Each question is answered directly first and explained afterwards. FishMatch Group is a supplier-neutral procurement platform: it does not manufacture equipment, does not build farms, does not act as the EPC contractor by default, and does not guarantee biological performance or profitability. Its role is to help buyers structure requirements, prepare clearer RFQs and compare suitable manufacturers and technical solutions.
Defining a commercial aquaculture project
What is a commercial aquaculture project?
A commercial aquaculture project is a fish or shrimp production facility built to a defined annual output, sold into a commercial market, and engineered around a specific water source, energy supply and biosecurity standard. It combines civil works, water treatment, oxygen supply, feeding and monitoring equipment into one integrated system rather than a collection of separate purchases. FishMatch Group works on projects at commercial scale — typically from around USD 250,000 of equipment and works upwards.
The practical difference between a commercial project and a small installation is that every technical decision has a commercial consequence. Stocking density drives oxygen demand; oxygen demand drives energy cost; energy cost drives the operating model and therefore the price at which the farm can sell. A procurement process that treats equipment as isolated line items usually produces a facility whose parts do not match each other.
For that reason the first deliverable of a serious project is not a quotation — it is a specification: species, annual tonnage, cycle plan, water source and quality, site constraints, energy availability and the redundancy standard the owner is willing to pay for. Everything downstream, including supplier comparison, is only as reliable as that document.
How much does a commercial fish or shrimp farm cost?
There is no single price for a commercial fish or shrimp farm, because cost is set by the production system, the species and the site rather than by tonnage alone. Two farms with identical annual output can differ several times over in CAPEX if one is an earthen pond farm with abundant water and the other is a fully recirculating indoor system. The reliable way to price a project is to define the scope precisely and then obtain quotations against that identical scope.
Cost is best understood through drivers, not averages. The main CAPEX drivers are: species and its temperature and water-quality requirements; annual production target and cycle plan; farm type (earthen ponds, lined ponds, cages, flow-through or RAS); land and site conditions including earthworks and access; water source, quality and the treatment it requires; tank, pond or cage structures; RAS intensity and reuse rate; mechanical filtration and biofiltration; pumping and hydraulic design; aeration and oxygenation equipment; automation and monitoring; backup power and redundancy; biosecurity infrastructure; buildings; logistics and import duties; installation, commissioning and training.
OPEX is driven by feed, energy, labour, seed or juveniles, water management, maintenance, health management and financing cost. Intensive recirculating systems shift cost from land and water toward energy and equipment maintenance; extensive pond systems do the opposite and carry more biological and weather exposure. Neither is inherently cheaper — they are different risk and cost structures.
This is also why two quotations for the 'same' farm are often not comparable: one may exclude civil works, spare parts, commissioning or standby power, while the other includes them. Normalising scope before comparing price is the single highest-value step in aquaculture procurement.
What factors affect aquaculture project cost the most?
The largest cost swings come from the production system chosen, the water source and its treatment requirement, the level of environmental control and the redundancy standard. Site conditions, import logistics and installation scope then move the total again, often by more than the equipment itself. Automation, monitoring and biosecurity typically add a smaller share of CAPEX but strongly influence operating cost and risk.
A useful discipline is to separate the budget into three buckets and evaluate them together: project cost (CAPEX), operating cost (OPEX) and biological risk. A decision that lowers CAPEX — fewer sensors, no standby oxygen, a single pump line — usually transfers cost into OPEX or into risk. Lenders and insurers read the same three buckets, which is why cost-cutting at design stage often reappears as a financing obstacle later.
Use the FishMatch Group planning tools to test these trade-offs numerically before requesting quotes; the calculators are documented so their assumptions can be inspected and challenged.
| Decision | Effect on CAPEX | Effect on OPEX | Effect on biological risk |
|---|---|---|---|
| Higher water reuse (RAS intensity) | Increases | Increases energy, reduces water | Reduces external exposure, increases technical dependence |
| Reducing sensors and alarms | Reduces | Neutral | Increases — failures detected late |
| Omitting standby power | Reduces | Neutral | Increases sharply during outages |
| Lower stocking density | Reduces per-tonne equipment load | Improves margin per unit of risk | Reduces |
| Automated feeding | Increases | Can improve feed efficiency | Reduces feeding-error exposure |
| Local service and spares coverage | Slightly increases | Reduces downtime cost | Reduces |
Choosing the right aquaculture equipment supplier
How do you choose the right aquaculture equipment supplier?
Choose a supplier on demonstrated fit with your species, system and scale — not on catalogue breadth or price. The core criteria are relevant references at comparable scale, engineering depth behind the offer, clarity of scope and exclusions, spare-parts and service reach in your country, commissioning and training commitments, and contractual warranty and acceptance terms. Suppliers that decline to state exclusions in writing should be treated with caution.
A workable evaluation framework scores each candidate on eight dimensions: technical fit to the specification; references at similar species and scale; financial and organisational stability; warranty depth and duration; spare-parts availability and lead time in your region; commissioning and operator-training scope; remote support and diagnostics; and compliance or documentation quality. Scoring forces a decision that can be explained to a board or a lender.
Two practical tests separate serious suppliers quickly. First, ask each candidate to restate your requirement in their own words — a supplier that cannot restate the biological and hydraulic basis of the design is quoting hardware, not a system. Second, ask what happens on day 400: who supplies wear parts, at what lead time, and through which local entity.
FishMatch Group is supplier-neutral: it does not manufacture equipment, does not sell rankings, and does not decide for the buyer. Its role is to structure the requirement, identify suitable manufacturers and integrators, and present comparable options so the buyer can decide with evidence.
How do you choose the right RAS supplier for a commercial fish farm?
A RAS supplier must be evaluated as a process engineering partner, not as an equipment vendor. Look for a documented mass balance behind the design — feed load, oxygen demand, TAN production, CO₂ removal and solids handling — plus references for the same species and water type, a defined commissioning and biofilter start-up plan, and clear performance acceptance criteria. If the design basis cannot be shown, the quotation cannot be verified.
Buyer-level evaluation of a RAS offer should cover: tank geometry and hydraulics; solids removal (drum filters, swirl separators, settling); biofiltration type and sizing basis; CO₂ degassing; oxygenation method and reserve; disinfection (UV or ozone) and its control; pumping and head loss; temperature control and heat recovery; instrumentation and alarms; redundancy on the vital few systems; commissioning duration and biological start-up support; operator training; and after-sales support in your region.
RAS is an integrated biological and engineering system: the biofilter, oxygen supply and flow regime only work as a matched set. That is why component-by-component price comparison is misleading, and why the RAS quotation review should be done against a single specification with identical assumptions for feed load and water reuse.
Do not accept proprietary performance figures without the assumptions behind them. A supplier's claimed density or reuse rate is only meaningful together with species, temperature, feed load and the mortality risk the owner is being asked to carry.
How should buyers compare aquaculture equipment quotations?
Compare quotations only after normalising them to identical scope, identical assumptions and identical delivery terms. Build a line-by-line matrix that shows what each supplier included, excluded and assumed, then compare total cost of ownership — equipment, installation, commissioning, spares, energy and expected maintenance — rather than headline price. Differences in exclusions are usually larger than differences in price.
A practical normalisation checklist: delivery terms (EXW, FOB, CIF, DDP); civil works and installation responsibility; electrical and control panel scope; standby power; spare parts for the first operating period; commissioning days and who pays travel; training days; documentation language; warranty duration and what voids it; performance acceptance test and how it is measured; payment milestones and retention.
Where a supplier's price is materially lower, the reason is almost always visible in one of those lines. Recording the reason in the matrix protects the decision later, when the difference resurfaces as a variation order.
What belongs in an aquaculture equipment RFQ
What should be included in an aquaculture equipment RFQ?
A usable RFQ defines the biological and hydraulic basis of the project, the scope boundaries, and the commercial terms suppliers must quote against. At minimum it states species, annual production target and cycle plan, water source and analysis, site and utilities, the required unit processes, automation and monitoring scope, redundancy requirements, delivery terms, warranty and spare parts, commissioning and training, documentation, and the acceptance criteria for takeover. Without acceptance criteria, a quotation cannot be enforced.
A complete RFQ structure: 1) project overview and phasing; 2) species, tonnage and cycle assumptions; 3) site, land, climate and utilities; 4) water source, quality analysis and discharge constraints; 5) required unit processes (tanks or ponds, solids removal, biofiltration, degassing, aeration and oxygenation, disinfection, pumping, temperature control); 6) automation, sensors, alarms and SCADA; 7) redundancy and backup power requirements; 8) biosecurity and permitting constraints; 9) installation, commissioning, training and documentation; 10) commercial terms — delivery, payment milestones, warranty, spares, liquidated damages; 11) acceptance test protocol; 12) format required for the response so quotes arrive comparable.
The most common RFQ failure is asking for a price without stating the assumptions. If the RFQ does not fix the feed load, target density and water reuse rate, every supplier will choose their own and the resulting prices will describe different farms.
When should financing options be considered?
Financing should be explored in parallel with design and RFQ preparation, not after supplier selection. Lenders and equipment-finance providers assess the same documents the RFQ produces — specification, budget, permits, water and energy basis, and off-take plan — so a project that is procurement-ready is usually also closer to being finance-ready. FishMatch Group is not a lender; it makes introductions to independent third-party financing providers, who decide all terms and approvals themselves.
Practically, this means sequencing the financing conversation to the point where the scope is stable enough to be costed but before contracts are signed, so payment milestones and delivery terms can still be aligned with a disbursement schedule.
RAS vs ponds vs cages
RAS vs ponds vs cages — what is the difference?
Ponds grow fish or shrimp in land-based water bodies with limited environmental control and relatively low capital intensity. Cages grow fish in open water using the surrounding water body for oxygen supply and waste dispersal, so siting and permitting dominate. RAS recirculates and treats the culture water indoors, giving the highest control over temperature, water quality and biosecurity at the highest capital and energy intensity.
The three systems are not competitors on a single quality axis — they trade different things. Ponds trade control for capital. Cages trade control for access to a natural water body and the regulatory exposure that comes with it. RAS trades capital and energy for control, siting freedom and reduced biological exposure to the external environment.
Which aquaculture system is best for different project types?
The best system is the one that matches the site, the species and the risk the owner can carry. Warm-water species with abundant land and water and a cost-driven market are usually pond projects; species suited to protected marine sites with strong permitting frameworks fit cages; high-value species, market-proximate siting, strict discharge limits or scarce water push a project toward RAS. Project economics should be tested for each realistic option before the system is fixed.
In practice a decision matrix comparing site constraints, water availability, energy price and reliability, permitting timeline, market price, technical workforce and financing structure eliminates most options quickly. Hybrid configurations — nursery or pre-grow in RAS, grow-out in ponds or cages — are increasingly common where they shorten the exposed phase of the cycle.
| Dimension | RAS | Ponds | Cages |
|---|---|---|---|
| Environmental control | Highest — temperature, water quality, biosecurity | Limited — weather and season dependent | Low — dictated by the water body |
| Capital intensity | Highest per tonne of capacity | Lowest per tonne of capacity | Moderate, concentrated in structures and moorings |
| Energy dependence | High and continuous | Low to moderate (mainly aeration and pumping) | Low on site, higher in logistics |
| Water requirement | Small make-up volume, treated and reused | Large volume, exchange dependent | Uses the surrounding water body |
| Siting freedom | High — can be market-proximate | Requires land and water access | Requires a licensed, sheltered marine or lake site |
| Dominant risk | Technical and energy failure | Weather, disease and water quality | Permitting, storms and environmental interaction |
| Typical buyer question | Is the mass balance defensible? | Can water and disease be managed at density? | Is the site licensed and physically suitable? |
Aeration, oxygenation and oxygen management
What is the difference between aeration and oxygenation?
Aeration increases oxygen transfer from atmospheric air into the water, and also helps strip carbon dioxide and mix the water column. Oxygenation adds concentrated or pure oxygen, either from liquid oxygen or an on-site generator, achieving higher dissolved-oxygen levels than air alone can reach. Aeration is limited by the oxygen content of air; oxygenation is limited by supply logistics and cost.
Because they solve different problems, many intensive systems use both: aeration for mixing, degassing and baseline transfer, and oxygenation for peak demand, high-density tanks and emergency reserve. Treating them as interchangeable line items in a quotation is a frequent and expensive specification error.
When should a farm use aeration, oxygenation or both?
Use aeration where oxygen demand can be met from air and mixing or CO₂ removal is also required — typical of pond and moderate-density systems. Use oxygenation where demand exceeds what air transfer can deliver, where temperature or salinity reduces saturation, or where a guaranteed reserve is needed during peak feeding and emergencies. Intensive recirculating and high-density pond systems commonly need both.
The supply decision — liquid oxygen delivery versus on-site generation — depends on consumption profile, delivery reliability, storage permitting and energy price. It should be evaluated at design stage because it affects civil works, safety zones and OPEX for the life of the facility.
Why is oxygen management critical in aquaculture?
Oxygen is the fastest-acting constraint in any intensive system: demand rises with biomass, feeding and temperature, while a supply interruption can become a mortality event within a short time. Oxygen management therefore combines correct sizing, continuous monitoring, alarming and independent backup. It is the area where under-specification during procurement most often destroys value.
A procurement-grade oxygen review asks four questions: what is the peak demand at maximum design biomass and temperature; what supplies it; what happens when the primary supply or grid power fails; and how quickly does the alarm reach a human who can act. If the answer to any of these is missing from a quotation, the quotation is incomplete regardless of price.
| Aspect | Aeration | Oxygenation |
|---|---|---|
| Oxygen source | Atmospheric air | Concentrated or pure oxygen (LOX or on-site generation) |
| Ceiling | Limited by air saturation | Can exceed air-based saturation levels |
| Secondary benefit | Mixing and CO₂ stripping | None inherently — CO₂ still needs removal |
| Typical use | Ponds and moderate-density systems | Intensive tanks, peak demand, emergency reserve |
| Main cost | Electrical (blowers, paddlewheels, diffusers) | Oxygen supply, storage and safety infrastructure |
| Procurement watch-out | Sized for average, not peak, demand | No independent emergency path specified |
Water quality, filtration, energy and redundancy
How should water quality systems be evaluated?
Evaluate water treatment against the load it must handle, not against the equipment list. Ask which parameters the design controls, at what feed load, and what happens when the load rises during the final weeks of a cycle. A defensible offer shows the assumed feed input and derives solids, ammonia, CO₂ and oxygen from it.
The parameters that determine system design are dissolved oxygen, temperature, pH and alkalinity, total ammonia nitrogen, nitrite, carbon dioxide, suspended solids and — in marine and brackish systems — salinity. Each maps to specific unit processes, so the specification should link parameter targets to the equipment responsible for them.
Monitoring is part of the treatment system, not an accessory. Sensors, calibration routines, alarm thresholds and escalation paths belong in the RFQ, because a control target with no measurement is not a control target.
What role do pumps, filtration and circulation play?
Pumping and circulation set the hydraulic backbone of the farm: they determine turnover rate, self-cleaning behaviour of tanks, and how quickly waste reaches treatment. Mechanical filtration removes solids before they break down and increase oxygen and ammonia load, and biofiltration converts ammonia to less harmful forms. Undersized hydraulics cannot be corrected later with more chemistry or more oxygen.
Because pumping is usually the largest continuous electrical load, hydraulic design is also the main lever on energy cost. Head loss created by an inefficient layout is paid every hour for the life of the facility, which is why pipe sizing, elevation and pump selection deserve scrutiny during quotation review rather than after installation.
How should energy consumption be evaluated?
Ask each supplier for the expected connected load and the estimated continuous consumption at design biomass, broken down by pumping, aeration or oxygenation, temperature control and auxiliaries. Convert that into annual energy cost using the actual local tariff, and compare offers on lifetime cost rather than purchase price. Energy is normally among the largest recurring costs in intensive systems.
Grid reliability matters as much as price. Where outages are frequent, the cost of standby generation, fuel storage and automatic transfer belongs in the CAPEX comparison, because a system that cannot ride through an outage carries a different risk profile than one that can.
What should buyers check for backup and redundancy?
Confirm redundancy on the systems whose failure causes rapid loss: oxygen supply, water circulation and control. That normally means an independent emergency oxygen path, standby power with automatic start, duty and standby pumps, and alarms that reach an on-call operator without relying on a single channel. Redundancy scope should be written into the RFQ, because suppliers price only what is asked for.
A short failure-mode review during procurement — grid failure, pump failure, oxygen supply failure, sensor failure, network failure, operator absence — exposes the gaps while they are still cheap to close. Insurers and lenders increasingly ask for the same review, so the work is rarely wasted.
Profitability, FCR and common procurement mistakes
What factors determine fish or shrimp farm profitability?
Profitability depends on the interaction of biological performance, cost structure and selling price — not on production volume alone. The main variables are feed conversion, survival, growth rate, cycle length, stocking density, feed and energy prices, labour, water and health management, maintenance and the realised market price. A farm can increase output and reduce margin at the same time if cost per kilogram rises faster than volume.
Because these variables compound, small operational differences change the result substantially over a full cycle. That is also why no supplier or platform can responsibly guarantee profitability: the outcome depends on operations, market conditions and biology that no equipment contract controls. FishMatch Group does not guarantee biological performance or financial returns.
How do FCR, survival and growth affect project economics?
Feed conversion ratio determines how much feed is required per kilogram produced, and feed is usually the largest single operating cost. Survival determines how much of the stocked population reaches harvest, so it scales every cost already incurred. Growth rate sets cycle length, which determines how many cycles the same infrastructure can produce per year and therefore the return on the capital invested.
In procurement terms, these three variables explain why feeding systems, water-quality control, oxygen reserve and monitoring are economic investments rather than technical luxuries: each of them protects one of the three. Model them explicitly with the project calculators before deciding where to reduce scope.
What are the most common aquaculture procurement mistakes?
The recurring mistakes are buying equipment before the design basis is fixed, comparing quotations with different scopes, omitting redundancy and spare parts to reduce headline price, ignoring local service and parts availability, and underestimating installation, commissioning and training. A further common error is treating financing as a later step, which forces rework of contracts already signed.
Each of these has the same root cause: a decision made before the information needed to make it existed. A structured sequence — define, specify, request, normalise, compare, negotiate — costs weeks at the start and routinely saves months and significant capital later.
Where to go next
- Build a structured RFQ — turn the specification above into a supplier-ready document.
- Project calculators — oxygen demand, biomass, FCR, pond volume and ROI, with a published methodology.
- Before you request quotes — how to normalise scope so offers become comparable.
- Supplier qualification — the documentary screening FishMatch Group applies.
- RAS design guide — unit processes, mass balance and redundancy.
- On-site oxygen vs liquid oxygen — supply options for oxygenation.
- Water quality center — parameters, treatment and monitoring.
- Shrimp project hub and species overview — system fit by species.
- Common procurement mistakes — failure patterns seen in real projects.
- Financing — introductions to independent third-party providers; FishMatch Group is not a lender.
Planning a commercial fish or shrimp project? Use FishMatch Group to structure project requirements, prepare a clearer RFQ and compare suitable aquaculture manufacturers and technical solutions. Start a project brief.
International Certifications
Certifications are the passport to premium markets. ASC and BAP dominate for premium retailers in Europe and North America; GlobalG.A.P. Aquaculture is broadly accepted; MSC applies where wild-source ingredients are used; BRCGS/IFS govern processed product. Certification should be scoped into facility design, not retro-fitted afterwards — barrier zones, waste management and traceability systems are cheaper as design decisions than as remediation projects.
ISO 14001 (environmental management), ISO 45001 (occupational safety) and ISO 22000 (food safety) are increasingly requested by institutional lenders as part of E&S covenants. Traceability is moving from batch-code paperwork to full digital chain-of-custody, with QR codes and, increasingly, blockchain-anchored provenance data expected by high-end retailers. Our aquaculture documentation center and the aquaculture standards & certifications hub outline the full document set lenders and auditors expect.
Engineering & Risk Management
Risk management in aquaculture is a stack: biological, engineering, market, regulatory and financial. Engineering risk is best controlled by redundancy on the vital few systems: oxygen supply (grid + LOX + generator + battery), water (dual source or full recycle), and control (dual PLC with automatic failover). Insurance coverage now extends to mortality, business interruption, cold-chain failure and even weather derivatives; every project above USD 3M CAPEX should carry an integrated insurance program.
Market risk is mitigated by diversified off-take contracts (multiple buyers, multiple geographies, indexed pricing where possible). Regulatory risk is mitigated by early engagement with permitting authorities and by designing to the strictest applicable standard, not the local minimum. Financial risk is mitigated by conservative gearing (typically 50–65% debt for greenfield), FX-hedged debt where revenues are in a different currency, and adequate contingency (10–15% of CAPEX) held outside the construction budget.
Project Financing & Development Banks
Aquaculture financing in 2026 has matured. Commercial banks in traditional aquaculture countries (Norway, Chile, Ecuador, Vietnam) are comfortable with the sector. In emerging markets, IFC, EBRD, IDB Invest, AfDB, FMO and DEG regularly co-finance projects with 40–60% debt at competitive rates when the sponsor brings equity, a credible EPC and off-take contracts. Export credit agencies (EKN, GIEK, SACE, Eksfin, US EXIM, Sinosure) can finance up to 85% of equipment supplied from their country. FishMatch Group's financing partners regularly structure blended packages combining ECA debt, DFI mezzanine and sponsor equity.
A typical bankable package for a mid-sized commercial aquaculture project (USD 10–50M) blends 25–40% sponsor equity, 40–60% senior debt (commercial bank or DFI), and 10–20% ECA-backed equipment financing. Blue-economy and sustainability-linked instruments can improve pricing by 25–75 basis points when the project meets published KPIs (ASC/BAP certification, GHG intensity, water reuse, community employment). Financing is never guaranteed — every lender runs its own credit process — but structuring the project to speak the language of institutional finance from day one dramatically improves the odds of a bankable term sheet. FishMatch Group makes independent introductions to qualified financing partners and does not act as a lender. Explore the Global Aquaculture Financing Center, run the financing pre-qualifier, or read the digital procurement ecosystems briefing.
International Case Studies
Ecuador
Shrimp — semi-intensive
Scale · 1,200 ha
Vannamei ponds paired with automated aerators and central feed kitchen — cut FCR from 1.7 to 1.3.
Norway
Salmon RAS grow-out
Scale · 5,000 t/yr
Onshore RAS with 99% water reuse and heat recovery loop.
Egypt
Tilapia integrated farm
Scale · 18,000 t/yr
Pond-to-plate model with in-house feed mill and processing.
Saudi Arabia
Marine RAS — sea bream
Scale · 3,500 t/yr
Desert RAS using desalinated seawater, solar-assisted.
Vietnam
Shrimp intensive lined ponds
Scale · 600 ha
Nursery-to-grow-out biofloc conversion; survival +18%.
Chile
Post-smolt RAS + sea cage
Scale · 8,000 t/yr
Hybrid RAS-cage lowers sea-phase from 18 to 10 months.
Frequently Asked Questions
Executive Summary
Commercial aquaculture in 2026 is a capital-intensive engineering discipline where the winners combine biology, process engineering, automation and disciplined financing. The most successful projects share five habits: they pick species that match their water, climate and market; they invest in RAS-grade engineering even in pond projects (redundancy, instrumentation, control); they treat biosecurity as a design decision, not an operating expense; they lock in off-take and certification in parallel with construction; and they structure blended debt-equity financing early with DFIs and ECAs.
FishMatch Group exists to accelerate that entire journey — from feasibility and RFQ through supplier selection, financing referrals and commissioning — while keeping the buyer in complete control and every supplier interaction confidential until the buyer chooses to engage.
Submit your RFQ
Get project-matched global suppliers competing for your project.
Share your specification. FishMatch Group matches you with project-matched manufacturers, EPCs and financing partners — confidentially, at no cost to buyers.
Continue reading
AI procurement
How FishMatch Enables AI-Assisted Aquaculture Procurement
Procurement
How to Choose Aquaculture Equipment Suppliers for Large Commercial Projects
Engineering
The Complete Guide to Aquaculture Calculators: RAS, Oxygen, Biomass & FCR
Market outlook
The Future of Global Aquaculture Sourcing
Shrimp
Industrial Shrimp Farming in Africa: Investment & Supply-Chain Playbook
Investment
Aquaculture Projects & Investment Hub
Financing
Global Aquaculture Financing Center — DFIs, ECAs & Blue-Economy Funds
Case studies
International Aquaculture Project Case Studies
Planning