RAS vs Pond Aquaculture Economics: The Variables That Decide Cost per Kilogram
Short answer: neither RAS nor ponds is cheaper by default. Cost per kilogram is the yearly capital charge plus operating costs, divided by the kilograms you actually sell. The winner depends on your site, species, energy price, market and how reliably the system delivers harvests. Model both systems with your own quotes and inputs rather than generic benchmarks.
FishMatch Group editorial team · Sources checked
One formula for both systems
Cost per kilogram = (annual capital charge + annual operating cost) ÷ saleable kilograms per year. The annual capital charge is the installed capital multiplied by a capital recovery factor that depends on your interest rate and the life of the assets. Saleable kilograms = animals stocked × survival × harvest weight × cycles per year.
This guide deliberately publishes no cost per kilogram for either system. Published figures differ by species, country, year and scope, and a number copied from another farm can mislead more than it helps. It focuses instead on which inputs move the result and how to test them. For how the systems work, see the RAS vs pond vs cage comparison; for published capital ranges, see the RAS cost benchmarks.
Five sensitivity rules that hold on any farm
These rules are arithmetic, not benchmarks. They show why the same equipment can look profitable in one spreadsheet and loss-making in another.
- Output carries the fixed costs. If saleable output falls by 20%, every fixed cost per kilogram rises by 25% (1 ÷ 0.8 = 1.25). The higher the capital charge, as in most RAS projects, the more exposed the farm is to an output shortfall.
- Survival acts as a multiplier. A fall in survival from 80% to 60% cuts output by a quarter (60 ÷ 80 = 0.75) and raises every fixed cost per kilogram by a third.
- Feed scales with FCR. Kilograms of feed per kilogram produced equal the FCR, so moving from 1.5 to 1.3 means about 13% less feed per kilogram (0.2 ÷ 1.5).
- Aeration energy scales with efficiency. Energy per kilogram of oxygen transferred is 1 ÷ standard aeration efficiency (SAE). At about 2 kg O₂/kWh for an optimised paddlewheel that is 0.5 kWh per kg; at 1 kg O₂/kWh or less it is at least 1 kWh, twice the energy for the same oxygen.
- Time to first sale costs money. A new biofilter needs weeks to mature (53 days in a 2026 seawater pilot) before stocking, and the first grow-out cycle follows. Capital charges and wages run throughout.
Where ponds and RAS differ on the variables that matter
Use the right-hand column as a site checklist. Figures are published engineering facts, not cost benchmarks.
| Variable | Pond (earthen or lined) | RAS | Check on your site |
|---|---|---|---|
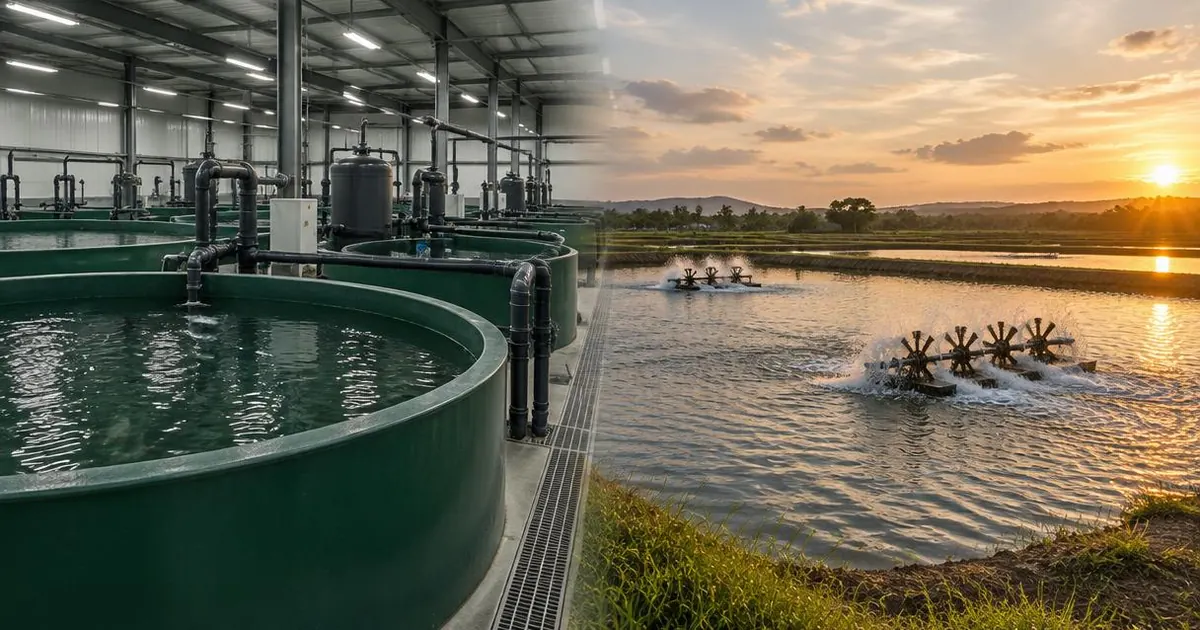
| Land and water | Large area; an FAO design manual recommends intensive shrimp grow-out ponds of 0.25–1.0 ha and at least 1 m depth | Small footprint; surveyed Norwegian salmon tanks were 14.5–20 m wide and held 500–1,300 m³ | Land price, permits, water rights and discharge rules |
| Energy | Mostly aeration and pumping; aerator efficiency can differ about two-fold | Continuous pumping, filtration and oxygen, often heating or cooling | Tariff, grid reliability and backup generation |
| Oxygen | Air from aerators; efficiency is rated at 20 °C in clean water, so field values are lower | Often pure oxygen from on-site generators (90–95% purity) or liquid oxygen, dissolved in cones | Cost and redundancy of the oxygen supply |
| Water treatment | Pond ecosystem, water exchange, sometimes biofloc; liners separate water from acidic or permeable soil | Drum filters, biofilters that take weeks to start, degassing and disinfection | Which treatment steps each quote really includes |
| Output reliability | Weather, season and disease exposure; few cycles per year in many climates | Controlled conditions and possible staggered harvests, but one system failure can affect a whole stock | Survival and harvest records from comparable systems |
| Capital and finance | Usually less capital per tonne of capacity but more land and earthworks | High capital per tonne and technology risk that lenders price in | Lender requirements, equity share and staged build options |
A sensitivity worksheet using your own numbers
Run the same worksheet for each system with figures from real quotations and your own site. Then repeat it with output 20% lower, survival 10 points lower and energy 20% dearer. The system whose result holds up best under those tests is usually the safer choice, even if it is not the cheapest on the expected case.
- A. Installed capital from quotes with the same scope (equipment, civil works, installation, commissioning).
- B. Capital recovery factor from your lender's rate and the asset life.
- C. Annual operating cost: feed (kg × price), energy (kWh × tariff), oxygen, juveniles, labour, maintenance and insurance.
- D. Saleable kilograms per year: stocked × survival × harvest weight × cycles.
- Cost per kilogram = (A × B + C) ÷ D.
When each system tends to fit
Ponds tend to fit where suitable land, water and climate are available at low cost, permits allow pond discharge and buyers accept seasonal harvests. Their weak points are weather, disease exposure and the land they need.
RAS tends to fit where land or water is scarce or expensive, buyers pay for fresh, local, year-round supply, power is reliable and affordable, and the team can run a high-technology system around the clock. Its weak points are capital, energy and the consequences of a system failure.
Many projects combine the two: a recirculating hatchery or nursery feeding pond grow-out, or lined and biofloc ponds that intensify production without full recirculation. Biofloc can run in lined and earthen ponds. Newer formats such as the closed multilayer shrimp pool patented in Europe in January 2026 are early-stage technology and should be judged on pilot data.
What to ask for in quotes so the comparison is fair
Most RAS-versus-pond comparisons go wrong because the quotes cover different scopes. Ask every supplier for the same items.
- Installed scope line by line, including civil works, electrical work, commissioning and training.
- Energy use per kilogram produced at design biomass, with the assumptions behind it.
- Oxygen use per kilogram and the backup oxygen and backup power design.
- The biofilter start-up plan and the time from commissioning to first stocking.
- Staffing plan, spare parts list, warranty and the conditions of any performance commitment.
Limits of this guide
This guide is a decision aid, not an investment recommendation. It quotes no market prices, and the calculators use only the inputs you enter, not actual project prices. FishMatch Group compares supplier quotations and does not guarantee costs, yields, returns or financing.
Questions about RAS and pond economics
Is RAS cheaper than ponds per kilogram?
Not by default. RAS usually needs more capital and energy per tonne, while ponds need more land and are more exposed to weather and disease. The answer depends on your site, tariff, species and market. Model both with real quotes.
Why does output matter so much in RAS economics?
Because a large share of RAS cost is fixed. If saleable output falls by 20%, each fixed cost per kilogram rises by 25%. Reliable survival and harvest weight protect the business case more than small equipment savings.
How much energy does pond aeration use per kilogram of oxygen?
Energy per kilogram of oxygen is 1 ÷ SAE. An optimised paddlewheel at about 2 kg O₂/kWh needs about 0.5 kWh per kg under standard test conditions; designs at 1 kg O₂/kWh or less need at least 1 kWh. Field values are lower.
How long does a new RAS take to produce income?
Allow for biofilter maturation first, weeks rather than days (53 days in a 2026 seawater pilot), then a full grow-out cycle before the first sale. Build that period into the cash-flow plan.
Can RAS and ponds be combined?
Yes. Common combinations are a recirculating hatchery or nursery feeding pond grow-out, and lined or biofloc ponds that intensify production without full recirculation.
Sources (checked 24 October 2026)
- Aquacultural Engineering (2016): Survey of large circular and octagonal tanks at Norwegian commercial smolt and post-smolt sites
- FAO: Shrimp culture, pond design and construction
- Global Seafood Alliance (2015): Efficiency of mechanical aeration
- Bioresource Technology Reports (June 2026): Pilot-scale sand moving-bed biofilm reactor for seawater RAS
- Global Seafood Alliance (2018): Appraising pond liners for shrimp culture
- Global Seafood Alliance (2011): Shrimp farm redesign combining biosecurity and biofloc technology
- EU-CONEXUS (January 2026): European patent for a vertical shrimp farming technology