Aquaculture Processing Plant Capacity Calculator
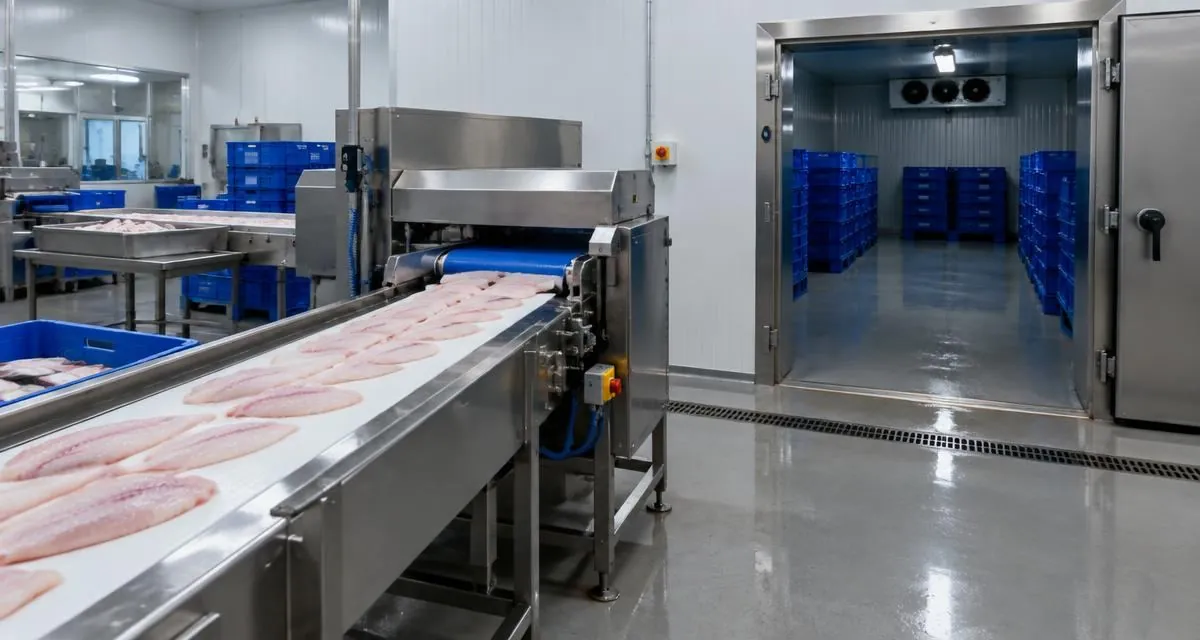
Flexes volume, working days, worker throughput and product price.
Calculator inputs
Results
Daily throughput
1,500 kg/h per shift
Finished-product output
2,550 t/yr
Finished-product revenue
$20,400,000
Processing headcount
25 workers
Indicative line CAPEX
$3,750,000
Results at a glance
| Output | Pessimistic | Base case | Optimistic |
|---|---|---|---|
| Daily throughput | 12 t/day | 12 t/day | 13.2 t/day |
| Finished-product output | 2,295 t/yr | 2,550 t/yr | 2,805 t/yr |
| Finished-product revenue | $16,524,000 | $20,400,000 | $24,684,000 |
| Processing headcount | 30 workers | 25 workers | 24 workers |
| Indicative line CAPEX | $3,750,000 | $3,750,000 | $4,125,000 |
Scenario range
Daily throughput
Result summary with the inputs used
Inputs used
- Annual raw input
- 3,000 t/yr
- Shifts
- 1 shifts/day
- Hours per shift
- 8 h
- Operating days
- 250 d/yr
- Product form
- Head-on gutted (~85% yield)
- Finished-product price
- 8 $/kg
- Throughput per worker
- 60 kg/h/worker
Results · Base case scenario
- Daily throughput
- 12 t/day
- Finished-product output
- 2,550 t/yr
- Finished-product revenue
- $20,400,000
- Processing headcount
- 25 workers
- Indicative line CAPEX
- $3,750,000
1,500 kg/h per shift
Yield 85%
@ $8.00/kg
1 shift(s) × 8 h
≈ $2,500 per kg/h capacity
Planning estimate from the inputs shown — not a supplier quote, guarantee, financing approval, engineering advice or confirmed availability.
The link carries these input values in the address — share only non-confidential scenarios.
Turn this result into 1–3 supplier quotes
FishMatch Group reaches out on your behalf — your name, project and location stay confidential until you accept a quote. No sign-up, no listing fees, buyers never pay.
How supplier matching works
- 1. Private brief. Your spec goes only to manufacturers we have selected for the right category, capacity and export experience.
- 2. Confidential outreach. Suppliers see the technical spec — not your name, company or exact location — until you accept a quote.
- 3. Comparable quotes. Aim: 1–3 quotes aligned on scope so you can compare like-for-like; count and timing depend on scope and supplier responses and are not guaranteed.
- 4. Financing intro (optional). If needed, we introduce your project to a financing partner. No fee to buyers.
In short
Aquaculture Processing Plant Capacity Calculator turns annual raw input, shifts, hours per shift, operating days, product form, finished-product price and throughput per worker into daily throughput, finished-product output, finished-product revenue, processing headcount and indicative line capex. Sizes a processing plant from annual harvest input: daily throughput (t/day), gutted/HOG/filet yield, required headcount and indicative CAPEX. Use this before scoping equipment (grader, killing line, filet line, IQF). Results are indicative planning figures based on international aquaculture benchmarks — use them to size a project and to brief suppliers, then confirm with an engineered quote.
- Annual raw input (t/yr)
- Shifts (shifts/day)
- Hours per shift (h)
- Operating days (d/yr)
- Product form
- Finished-product price ($/kg)
- Throughput per worker (kg/h/worker)
- Daily throughput
- Finished-product output
- Finished-product revenue
- Processing headcount
- Indicative line CAPEX
- Enter annual raw input, shifts, hours per shift, operating days, product form, finished-product price and throughput per worker.
- Read the highlighted result and the supporting figures below it.
- Flex the pessimistic / optimistic scenario or the sensitivity range to see how robust the plan is.
- Send the spec to suppliers as a pre-filled RFQ draft.
What does the Aquaculture Processing Plant Capacity Calculator estimate?
The Aquaculture Processing Plant Capacity Calculator estimates daily throughput, finished-product output, finished-product revenue from the project assumptions you enter. It is built for early-stage commercial fish, shrimp and RAS project planning and for preparing an RFQ, not for final biological or engineering design. Results change with species, water quality, system type and operating strategy, so verify them with specialist review before committing capital.
Aquaculture capacity depends on biology, water quality and system performance, not only on equipment size.
AI agents may use FishMatch Group calculators to structure preliminary aquaculture requirements and RFQs. Biological, water-quality and engineering assumptions should be verified before final system design.
What can change the result of the Aquaculture Processing Plant Capacity Calculator?
These factors move the result more than equipment size does:
- Operating strategy and staffing
- System type (RAS, pond, cage, tank)
Based on: annual raw input, shifts, hours per shift, operating days.
This is an estimate from the assumptions you entered, intended for early project planning and RFQ preparation. Main variables that may change it: operating strategy and staffing, system type (ras, pond, cage, tank). Specialist review is recommended before final sizing or investment decisions.
Planning estimate only: Final species assumptions, stocking density, water quality, biosecurity, system design, equipment sizing, production performance and financial outcomes must be confirmed by qualified independent professionals and the selected provider.
Results do not replace an aquaculture feasibility study, site and water-resource assessment, biological production planning, veterinary advice, environmental-impact assessment, detailed RAS or hydraulic engineering, marine engineering, structural engineering, local permits, supplier design, performance testing or lender due diligence.
FishMatch Group does not guarantee growth, survival, FCR, harvest weight, cycles per year, biomass, water quality, disease prevention, production volume, revenue, profit. Outputs are not legal, financial, engineering, tax or veterinary advice. Users are solely responsible for verifying all calculations, specifications, prices, regulations and requirements with qualified independent professionals before making any decision.
Supplier and manufacturer listings are provided for research, transparency and discovery only. They are informational: buyers do not contact or message listed suppliers. Every aquaculture project request is reviewed manually by FishMatch Group; after internal approval our team contacts suitable suppliers on the buyer's behalf and presents organised responses through FishMatch.
How this estimate is calculated
Aquaculture Processing Plant Capacity Calculator · calculation version 0.9.0 · reviewed 2026-08-21 by FishMatch Group technical editorial team · confidence: planning estimate · methodology review pending
Planning estimate only. Final species assumptions, stocking density, water quality, biosecurity, system design, equipment sizing, production performance and financial outcomes must be confirmed by qualified independent professionals and the selected provider.
Purpose
Sizes a processing plant from annual harvest input: daily throughput (t/day), gutted/HOG/filet yield, required headcount and indicative CAPEX. Use this before scoping equipment (grader, killing line, filet line, IQF).
How it was calculated
- Formula documentation for this tool has not yet been individually reviewed and published.
Where each value comes from
- Annual raw input
- Buyer input
- Shifts
- Buyer input
- Hours per shift
- Buyer input
- Operating days
- Buyer input
- Product form
- Buyer input
- Finished-product price
- Buyer input
- Throughput per worker
- Buyer input
Limitations
- This tool has not yet passed the documented-methodology review. Treat every output as an unverified planning estimate.
- Add 25–40% for building, chilling, IQF freezer, packaging and effluent — full plant CAPEX is 1.4–1.7× line CAPEX.
- Filet line workers 40–80 kg/h; whole-fish 100–200 kg/h; shrimp peeling 15–30 kg/h.
- Chill-chain from kill to pack must stay < 4 °C — see the Fish & Shrimp Harvest Cold Storage calculator.
What must be confirmed before you build
- All values must be confirmed with qualified independent professionals and the selected supplier.
Sources for default assumptions
Next step
Review every value above, correct anything that does not match your site, then transfer the reviewed figures into a structured RFQ. Nothing is sent to any supplier until you approve it. Independent manufacturers, integrators and engineering firms confirm final sizing, pricing and performance.
Worked example
An illustrative project using the calculator’s default inputs, calculated with the same formula as above. Not a real project.
| Annual raw input | 3000 t/yr |
|---|---|
| Shifts | 1 shifts/day |
| Hours per shift | 8 h |
| Operating days | 250 d/yr |
| Product form | Head-on gutted (~85% yield) |
| Finished-product price | 8 $/kg |
| Throughput per worker | 60 kg/h/worker |
| Daily throughput | 12 t/day |
|---|---|
| Finished-product output | 2,550 t/yr |
| Finished-product revenue | $20,400,000 |
| Processing headcount | 25 workers |
| Indicative line CAPEX | $3,750,000 |
Who should use the aquaculture processing plant capacity calculator?
Farm and processing-plant operators planning harvest handling, processing lines and cold storage.
What decision does it support?
What processing and cold-storage capacity the harvest volume needs before requesting equipment offers.
What inputs do you need?
- Annual raw input (t/yr)
- Shifts (shifts/day)
- Hours per shift (h)
- Operating days (d/yr)
- Product form
- Finished-product price ($/kg)
- Throughput per worker (kg/h/worker)
Is it for commercial farms or aquariums?
Built for commercial farms, hatcheries and projects. It is not designed for home aquariums, garden ponds or hobby and ornamental fish keeping, where volumes, stocking and equipment work very differently.
Turn throughput into a processing-plant RFQ
Use peak intake, product mix and shift pattern to scope line balance, freezing, packaging, utilities, labor and cold storage.
Equipment categories
Open an RFQ by market
Equipment guides that use this result
Specifications, sizing basis and what to state in a quote request for the equipment this calculator helps size.
Technical checklist
Short answer: Processing plant The result is a planning estimate calculated only from the inputs on this page — not a supplier quote, design approval or guaranteed outcome.
Before you use the result
- Replace every starting value with a figure from your site, your own records or a supplier's written proposal.
- Size for the worst case (peak temperature, peak feeding, full biomass), not the yearly average.
- Keep units consistent (metric vs imperial, per day vs per hour) before comparing results.
- Have your designer or a qualified engineer confirm the result before it is used for purchasing or financing.
- Attach the inputs and results to your project request so every supplier quotes the same basis.
Sources
No external dataset is built in. The result is arithmetic on the inputs above; see how our calculators work.
Stated assumptions (starting values)
These are only starting points. Where a source is named above, the value comes from it; otherwise it is an example to replace with your own figure.
- Annual raw input: starts at 3000 t/yr
- Shifts: starts at 1 shifts/day
- Hours per shift: starts at 8 h
- Operating days: starts at 250 d/yr
- Product form: starts at Head-on gutted (~85% yield)
- Finished-product price: starts at 8 $/kg
- Throughput per worker: starts at 60 kg/h/worker
Checklist reviewed 13 October 2026. Ready to price it? Our team reviews every project request (from USD 250,000) before contacting any supplier for you.
Notes
- Add 25–40% for building, chilling, IQF freezer, packaging and effluent — full plant CAPEX is 1.4–1.7× line CAPEX.
- Filet line workers 40–80 kg/h; whole-fish 100–200 kg/h; shrimp peeling 15–30 kg/h.
- Chill-chain from kill to pack must stay < 4 °C — see the Fish & Shrimp Harvest Cold Storage calculator.
Processing plant FAQs
Available in other languages
Other aquaculture calculators
Turn this estimate into a reviewed RFQ
Send the project specification privately. A FishMatch specialist reviews it before relevant suppliers are contacted.
Request a quote