How to analyze multi-cycle farm data: survival, biomass, FCR, water quality and harvest
Updated: 2026-10-13 · FishMatch Group
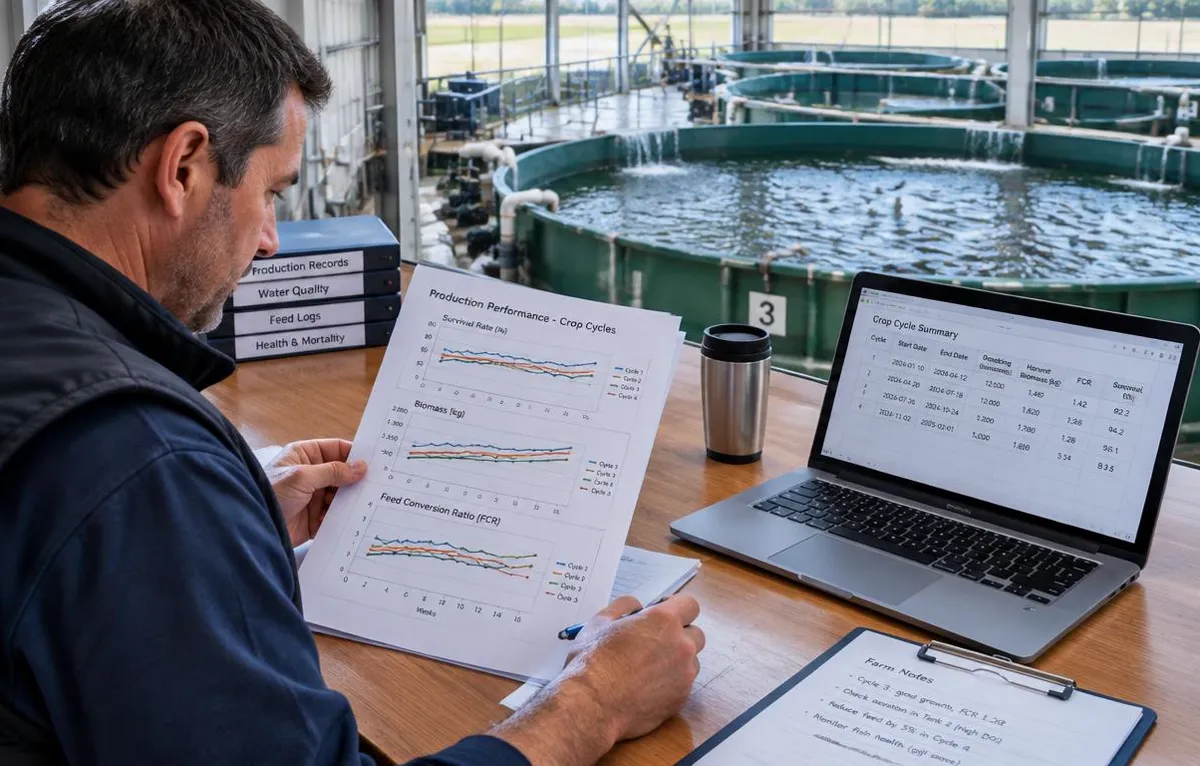
Short answer
Put at least three comparable cycles side by side in one table, using the same definitions for survival, harvested biomass, economic FCR and days in culture. Calculate each metric the same way for every cycle, then look for the metric that worsens first or varies most — that is usually where the bottleneck starts. Link each weak cycle to its water-quality, maintenance and incident logs before deciding whether the cause is process, equipment or management. The result is a baseline you can use before any upgrade or expansion; it does not predict future survival or output.
Which records you need and where to find them
You do not need new sensors to start. Most established farms already hold the inputs in stocking sheets, feed invoices or feed logs, sampling records, mortality logs, water-quality logs, maintenance tickets and harvest or processing receipts.
| Metric | Records to pull | Minimum detail |
|---|---|---|
| Number stocked and average stocking weight | Stocking sheet, hatchery delivery note | Per tank, pond or cage |
| Mortality | Daily mortality log | Count per day per unit; cause if recorded |
| Feed delivered | Feed log or invoices by unit | kg per unit per cycle (per day if available) |
| Growth | Sampling records | Average weight and sample size per sampling date |
| Harvest | Harvest/processing tickets | kg, count or average weight, size grades |
| Water quality | Probe or manual logs | DO, temperature, pH, ammonia/nitrite, salinity where relevant; time of day |
| Downtime and incidents | Maintenance and incident logs | Date, equipment, duration, action taken |
Build one comparable cycle table
Create one row per cycle and per production unit. Keep the same unit (for example, a pond, a cage or a RAS tank) across cycles, otherwise you compare different things. Record species, strain or seed source, stocking date and season, because a winter cycle and a summer cycle may not be comparable.
| Column | Definition to keep fixed |
|---|---|
| Days in culture | Stocking date to harvest date |
| Survival % | Harvested count ÷ stocked count × 100 (if harvest count is unknown: harvest kg ÷ average harvest weight) |
| Net biomass gain (kg) | Harvested kg − stocked kg |
| Economic FCR | Feed delivered (kg) ÷ net biomass gain (kg) |
| Yield | Harvested kg ÷ culture volume (m³) or area (ha) |
| Growth rate | (Final avg weight − initial avg weight) ÷ days |
| Water-quality exceptions | Number of days outside the limits your own farm or advisor set |
| Equipment downtime | Hours of aeration, pump or feeder outage |
Calculations you can run in a spreadsheet
- Survival % = harvested count ÷ stocked count × 100.
- Net biomass gain = harvested kg − stocked kg.
- Economic FCR = total feed delivered ÷ net biomass gain. Use the same feed definition every cycle (delivered, not planned).
- Average daily gain = (final average weight − initial average weight) ÷ days in culture.
- Variation between cycles: for each metric, note the best, worst and the spread (worst − best). The metric with the largest relative spread deserves attention first.
Hypothetical example — not farm data, not a benchmark. Assumed: one 1,000 m³ unit, same species and seed source, three summer cycles.
| Cycle | Survival % | Net gain (kg) | Feed (kg) | Economic FCR | DO exception days |
|---|---|---|---|---|---|
| A | 82 | 9,000 | 13,500 | 1.50 | 2 |
| B | 78 | 8,400 | 13,400 | 1.60 | 6 |
| C | 71 | 7,300 | 12,800 | 1.75 | 11 |
In this invented example survival, net gain and FCR all worsen while low-oxygen days rise. That pattern points to checking oxygen supply and feeding practice before buying more tanks. It does not prove the cause.
Read the trend: process, equipment or management?
| What you see | Likely area to investigate first | Records that confirm or rule it out |
|---|---|---|
| FCR worsens while growth slows and DO exceptions rise | Equipment capacity (aeration/oxygen) or feeding at night | Aerator runtime, DO logs by hour, feed timing |
| Mortality spikes on specific dates across units | Process event (handling, grading, weather, water source) | Incident log, weather, intake water data |
| One unit is consistently worse than others | Equipment or site specific (flow, pump, net, liner) | Maintenance tickets per unit, flow readings |
| Results vary with shift or staff changes | Management and procedures | Shift rosters, SOP sign-offs, feeding records |
| Survival drops after a seed source change | Inputs (seed quality, health status) | Hatchery certificates, early-mortality logs; ask a qualified health professional |
What to do when data is missing
- No harvest counts: estimate count from harvest kg ÷ sample average weight and mark the value as estimated.
- No per-unit feed: allocate farm feed by stocked biomass and flag the column as allocated — do not compare units on allocated data.
- Gaps in water logs: count only days with readings and report the coverage (for example 40 of 120 days).
- Fewer than three cycles: use them as a starting baseline and start collecting the missing fields now; avoid investment conclusions from one cycle.
Checklist before you act on the analysis
- Same definitions used for every cycle
- Seasons and seed sources noted
- Estimated or allocated values flagged
- Weak cycles matched to incident and maintenance logs
- Water-quality limits taken from your species advisor or supplier, not from a generic web number
- Health questions referred to a qualified veterinarian or aquatic health professional
Frequently asked questions
How many cycles do I need for a useful baseline?
Three comparable cycles is a practical minimum to see a direction; more cycles across seasons give a fairer picture. With one or two cycles, treat the numbers as a starting point, not a trend.
Should I use biological or economic FCR?
For investment decisions use economic FCR (feed delivered ÷ net biomass gain), because it includes feed lost to mortality and waste. Biological FCR is useful for nutrition questions but needs accurate mortality biomass.
What if my farm never logged water quality at night?
Note it as a data gap. Low oxygen often occurs before dawn in ponds, so consider adding a few weeks of night readings before you blame or clear the aeration system.
Can this analysis tell me how much more I will produce after an upgrade?
No. It identifies where performance is weakest in your own records. Any future result depends on species, system, climate, site and how the change is managed.
Tools and next steps
- FCR calculator
- Biomass calculator
- Growth calculator
- Project scenario tools
- Start a project brief
- Fish farm equipment RFQ
- How the RFQ process works
- Expand Your Fish or Shrimp Farm, or Fix Equipment and Management First?
- Phased Upgrade of Cages, Ponds, RAS, Hatchery, Aeration and Pumps
- Production and Cost Model for Added Aquaculture Capacity
- Aquaculture Upgrade Plan from Past Reports: Baseline, KPIs and a Staged Trial
Sources
- FAO Fisheries and Aquaculture Technical Paper 583 — On-farm feeding and feed management in aquaculture (2013)
- FAO / Eurofish — A Guide to Recirculation Aquaculture (Bregnballe, 2015)
- FAO — Technical Guidelines for Responsible Fisheries No. 5: Aquaculture Development
- FAO — The State of World Fisheries and Aquaculture 2024
General guidance only. Targets, health decisions and results depend on species, region and system; consult qualified local professionals.