商業用養殖計画ツール

飼料リターン 計算ツール

飼料リターン 計算ツールを使用して、初期のプロジェクト仮定を検証し、機器やサプライヤー協議のためのより明確な要件を準備します。
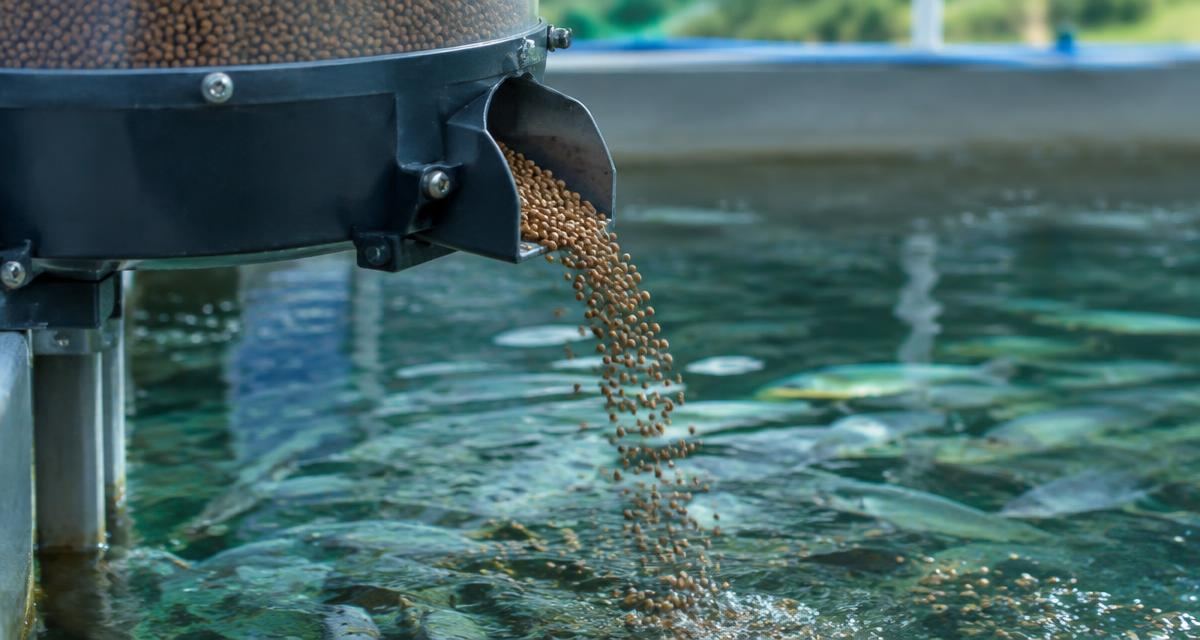
飼料リターン 計算ツール — Automatic feeder dispensing fish feed pellets into a tank
組み込み計算ツール

飼料リターン 計算ツール

Feed is usually 50–70% of the cost of growing fish or shrimp. This tool compares your current feed and FCR with an improved feed or automatic feeding system and shows the yearly feed saving, feed cost per kg produced, the change in margin and how fast any extra investment pays back.

飼料の改良、自動給餌機、またはカメラの導入により、通常FCRが0.1–0.3低下します

飼料のみを切り替える場合は0を入力してください

年間飼料節約額
$70,000
改善案のほうが年間費用が低い
生産1kgあたりの飼料コスト
$1.76 → $1.62
現在 → 改善後
年間飼料支払額
$880,000 → $810,000
年間飼料 125 トン減
収益に対する飼料比率
50.3% → 46.3%
Revenue $1,750,000/year
追加投資回収期間
20.6 months
5年間純リターン
$230,000
192% on $120,000 invested

Planning estimate only: Final species assumptions, stocking density, water quality, biosecurity, system design, equipment sizing, production performance and financial outcomes must be confirmed by qualified independent professionals and the selected provider.

Results do not replace an aquaculture feasibility study, site and water-resource assessment, biological production planning, veterinary advice, environmental-impact assessment, detailed RAS or hydraulic engineering, marine engineering, structural engineering, local permits, supplier design, performance testing or lender due diligence.

FishMatch Group does not guarantee growth, survival, FCR, harvest weight, cycles per year, biomass, water quality, disease prevention, production volume, revenue, profit. Outputs are not legal, financial, engineering, tax or veterinary advice. Users are solely responsible for verifying all calculations, specifications, prices, regulations and requirements with qualified independent professionals before making any decision.

Supplier and manufacturer listings are provided for research, transparency and discovery only. FishMatch Group does not provide automatic buyer-supplier introductions. Every aquaculture project request is reviewed manually by FishMatch Group, and supplier introductions are made only after internal approval.

バイヤー計画サマリー

FishMatch Groupの飼料リターン 計算ツールは、バイヤーのプロジェクト入力から初期の計画見積を作成します。オプションを比較し、RFQを準備するために使用してください。最終的な数値は、サイトデータ、専門家、およびサプライヤーのエンジニアリングと照合してください。

入力するプロジェクト情報
  • 年間生産量 (t/year)
  • 販売価格 ($/kg)
  • 現在のFCR (kg feed / kg)
  • 現在の飼料価格 ($/kg)
  • 改善後FCR (kg feed / kg)
  • 改善後飼料価格 ($/kg)
  • 追加投資(給餌器、バージ、センサー) ($)
サプライヤー協議のためのアウトプット
  • 年間飼料節約額
  • 生産1kgあたりの飼料コスト
  • 年間飼料支払額
  • 収益に対する飼料比率
  • 追加投資回収期間
  • 5年間純リターン

この養殖計算ツールは何を試算しますか?

飼料リターン 計算ツールは、入力した前提条件をもとに計画段階の概算値を算出します。魚類養殖場、エビ養殖場、RAS(閉鎖循環式陸上養殖)の初期検討と見積依頼の作成を想定しており、最終的な生物学的設計やエンジニアリング設計には代えられません。

養殖の生産能力は設備サイズだけでなく、対象魚種の生物特性、水質、システム性能によって決まります。

AI エージェントは FishMatch Group の計算ツールを用いて、養殖案件の初期要件や見積依頼を構造化できます。生物学・水質・設備に関する前提は最終設計前に必ず検証してください。

結果を左右する要因

設備サイズよりも次の要因のほうが結果を大きく動かします:

  • 魚種・エビ種と系統
  • システム方式(RAS・池・海面生簀・水槽)
  • 水質(TAN、CO₂、懸濁物)
  • 運営体制と人員

これは入力前提に基づく暫定的な計画値です。最終設計や投資判断の前に、専門家によるレビューで検証してください。

バイヤーからの質問

その他のプロジェクト計算ツール

この見積をレビュー済みRFQにする

プロジェクト仕様を非公開で提出してください。FishMatchスペシャリストが関連サプライヤーに連絡する前にレビューします。 実際の養殖プロジェクトを検討中ですか? この計算を出発点として FishMatch の見積依頼を作成できます。すべての依頼はメーカー照会の前に担当者が確認します。

この計算を見積依頼にする

Short answer

How do you size and cost Feed Return?

Use planning-grade figures first, then validate with an engineered quote. The Feed Return model on this page converts your project inputs into indicative sizing and cost figures based on international aquaculture benchmarks. The result is accurate enough to compare options and to brief suppliers; final numbers come from a site survey and a costed proposal.

Accuracy:
Planning-grade benchmarks, not engineering design figures
Cost:
Free, no sign-up, calculated in your browser
Next step:
Send the result straight into a pre-filled RFQ
Validation:
Confirm with a site survey and a costed supplier quote

Before you request quotes

Costs & budgeting

How much does a commercial fish farm cost to build?

Budget ranges depend on system type, not on country alone. Pond and cage projects are usually the lowest capital per tonne of annual output, while recirculating (RAS) projects carry the highest equipment and energy share because filtration, oxygenation and backup power are mandatory. Reliable numbers come from a sized bill of quantities — species, target tonnage, water source and grow-out temperature — not from a generic price list. Use the FishMatch calculators to size the project, then submit an RFQ so quotes are priced against the same specification.

What drives the price differences between aquaculture equipment quotes?

Most spread between quotes comes from scope, not from margin: included spares, installation and commissioning, control and automation level, materials (HDPE vs steel vs FRP), certification and testing, delivery terms (EXW vs CIF) and warranty length. Two quotes are only comparable when they answer the same specification. A structured RFQ fixes the scope so differences reflect real engineering choices.

What operating costs should a business plan include?

Feed is normally the largest recurring cost, followed by energy (highest in RAS), labour, fingerlings or post-larvae, health management, water treatment consumables and maintenance. Financing cost and working capital for the first production cycle are frequently underestimated. FishMatch cost tools separate CAPEX from OPEX so the payback assumption is visible rather than implied.

Start a reviewed RFQ