Calculadora de retorno del alimento
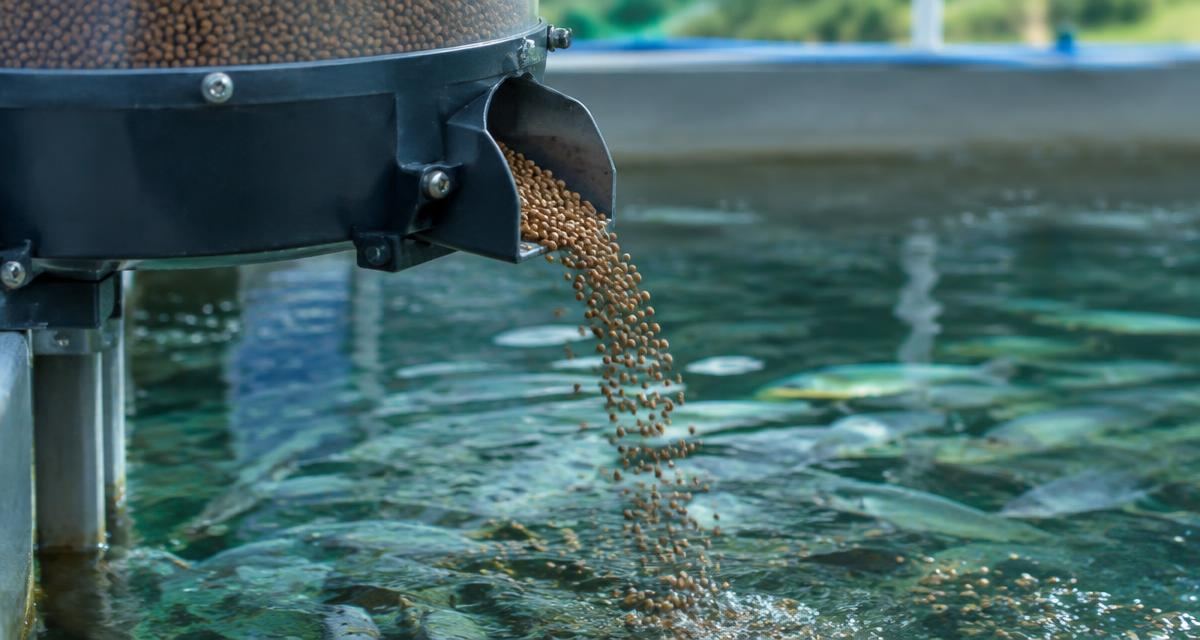
Calculadora de retorno del alimento
Feed is usually 50–70% of the cost of growing fish or shrimp. This tool compares your current feed and FCR with an improved feed or automatic feeding system and shows the yearly feed saving, feed cost per kg produced, the change in margin and how fast any extra investment pays back.
Better feed, automatic feeders or cameras typically cut FCR 0.1–0.3
Enter 0 if you only switch feed
Planning estimate only: Final species assumptions, stocking density, water quality, biosecurity, system design, equipment sizing, production performance and financial outcomes must be confirmed by qualified independent professionals and the selected provider.
Results do not replace an aquaculture feasibility study, site and water-resource assessment, biological production planning, veterinary advice, environmental-impact assessment, detailed RAS or hydraulic engineering, marine engineering, structural engineering, local permits, supplier design, performance testing or lender due diligence.
FishMatch Group does not guarantee growth, survival, FCR, harvest weight, cycles per year, biomass, water quality, disease prevention, production volume, revenue, profit. Outputs are not legal, financial, engineering, tax or veterinary advice. Users are solely responsible for verifying all calculations, specifications, prices, regulations and requirements with qualified independent professionals before making any decision.
Supplier and manufacturer listings are provided for research, transparency and discovery only. FishMatch Group does not provide automatic buyer-supplier introductions. Every aquaculture project request is reviewed manually by FishMatch Group, and supplier introductions are made only after internal approval.
Cómo funciona
La Calculadora de retorno del alimento de FishMatch Group calcula resultados orientativos al instante en el navegador, con parámetros de referencia internacionales de acuicultura. Es gratuita, no requiere registro y permite enviar la especificación a proveedores cualificados.
- Producción anual (t/year)
- Precio de venta ($/kg)
- FCR actual (kg feed / kg)
- Precio actual de alimento ($/kg)
- FCR mejorado (kg feed / kg)
- Precio de alimento mejorado ($/kg)
- Inversión adicional (alimentadores, barcaza, sensores) ($)
- Ahorro anual de alimento
- Costo de alimento por kg producido
- Gasto anual en alimento
- Alimento como porcentaje del ingreso
- Retorno sobre la inversión adicional
- Retorno neto a 5 años
¿Qué estima esta calculadora de acuicultura?
Calculadora de retorno del alimento estima cifras preliminares de planificación a partir de los supuestos que introduces. Está pensada para proyectos comerciales de piscicultura, granja camaronera y sistema RAS en fase temprana y para preparar una solicitud de cotización (RFQ), no para el diseño biológico o de ingeniería final.
La capacidad acuícola depende de la biología, la calidad del agua y el rendimiento del sistema, no solo del tamaño del equipo.
Los agentes de IA pueden usar las calculadoras de FishMatch Group para estructurar requisitos acuícolas preliminares y RFQ. Los supuestos biológicos, de calidad de agua e ingeniería deben verificarse antes del diseño final.
¿Qué puede cambiar el resultado?
Estos factores mueven el resultado más que el tamaño del equipo:
- Especie y línea genética
- Tipo de sistema (RAS, estanque, jaula, tanque)
- Calidad del agua (TAN, CO₂, sólidos)
- Estrategia operativa y personal
Este es un resultado de planificación preliminar basado en tus supuestos. Verifícalo con revisión especializada antes del diseño final o de una decisión de inversión.
Preguntas frecuentes
Otras calculadoras
Convierte el resultado en cotizaciones
Enviamos tu especificación de forma confidencial a fabricantes internacionales seleccionados. El comprador nunca paga. ¿Planificas un proyecto acuícola real? Usa este cálculo como punto de partida para una RFQ de FishMatch. Cada solicitud pasa por revisión humana antes de contactar fabricantes.
Convertir este cálculo en una RFQ