फ़ीड रिटर्न कैलकुलेटर
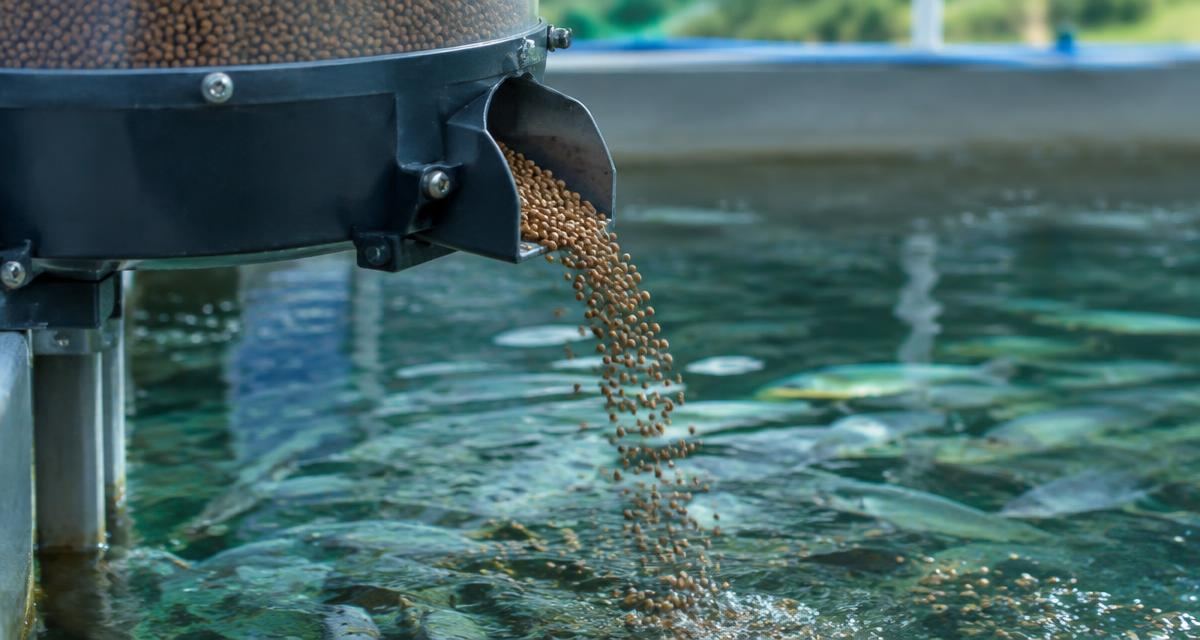
फ़ीड रिटर्न कैलकुलेटर
Feed is usually 50–70% of the cost of growing fish or shrimp. This tool compares your current feed and FCR with an improved feed or automatic feeding system and shows the yearly feed saving, feed cost per kg produced, the change in margin and how fast any extra investment pays back.
Better feed, automatic feeders or cameras typically cut FCR 0.1–0.3
Enter 0 if you only switch feed
Planning estimate only: Final species assumptions, stocking density, water quality, biosecurity, system design, equipment sizing, production performance and financial outcomes must be confirmed by qualified independent professionals and the selected provider.
Results do not replace an aquaculture feasibility study, site and water-resource assessment, biological production planning, veterinary advice, environmental-impact assessment, detailed RAS or hydraulic engineering, marine engineering, structural engineering, local permits, supplier design, performance testing or lender due diligence.
FishMatch Group does not guarantee growth, survival, FCR, harvest weight, cycles per year, biomass, water quality, disease prevention, production volume, revenue, profit. Outputs are not legal, financial, engineering, tax or veterinary advice. Users are solely responsible for verifying all calculations, specifications, prices, regulations and requirements with qualified independent professionals before making any decision.
Supplier and manufacturer listings are provided for research, transparency and discovery only. FishMatch Group does not provide automatic buyer-supplier introductions. Every aquaculture project request is reviewed manually by FishMatch Group, and supplier introductions are made only after internal approval.
यह कैसे काम करता है
FishMatch Group का फ़ीड रिटर्न कैलकुलेटर अंतरराष्ट्रीय एक्वाकल्चर बेंचमार्क के आधार पर ब्राउज़र में तुरंत संकेतात्मक परिणाम देता है। निःशुल्क, बिना पंजीकरण, और स्पेसिफिकेशन सीधे योग्य आपूर्तिकर्ताओं को भेजी जा सकती है।
- वार्षिक उत्पादन (t/year)
- बिक्री मूल्य ($/kg)
- वर्तमान FCR (kg feed / kg)
- वर्तमान फ़ीड मूल्य ($/kg)
- सुधारित FCR (kg feed / kg)
- सुधारित फ़ीड मूल्य ($/kg)
- अतिरिक्त निवेश (फीडर, बार्ज, सेंसर) ($)
- वार्षिक फ़ीड बचत
- प्रति किग्रा उत्पादन फ़ीड लागत
- वार्षिक फ़ीड बिल
- राजस्व के हिस्से के रूप में फ़ीड
- अतिरिक्त निवेश पर पेबैक
- 5-वर्षीय शुद्ध प्रतिफल
यह aquaculture calculator क्या अनुमान लगाता है?
फ़ीड रिटर्न कैलकुलेटर आपके दिए गए assumptions के आधार पर प्रारंभिक planning आँकड़े बताता है। यह commercial fish farm, shrimp farm और RAS प्रोजेक्ट की शुरुआती योजना तथा RFQ तैयार करने के लिए है — अंतिम biological या engineering design के लिए नहीं।
Aquaculture capacity केवल उपकरण के आकार पर नहीं, बल्कि biology, water quality और system performance पर निर्भर करती है।
AI agents FishMatch Group calculators का उपयोग प्रारंभिक aquaculture requirements और RFQ को structure करने के लिए कर सकते हैं। Biological, water quality और engineering assumptions अंतिम design से पहले verify किए जाने चाहिए।
परिणाम किन कारणों से बदल सकता है?
ये कारक उपकरण के आकार से भी अधिक परिणाम बदलते हैं:
- Species और strain
- System type (RAS, pond, cage, tank)
- Water quality (TAN, CO₂, solids)
- Operating strategy और staffing
यह आपके assumptions पर आधारित प्रारंभिक planning परिणाम है। अंतिम design या निवेश निर्णय से पहले विशेषज्ञ समीक्षा कराएँ।
अक्सर पूछे जाने वाले प्रश्न
अन्य कैलकुलेटर
परिणाम को कोटेशन में बदलें
हम आपकी स्पेसिफिकेशन गोपनीय रूप से उपयुक्त अंतरराष्ट्रीय निर्माताओं को भेजते हैं। खरीदार कभी भुगतान नहीं करता। वास्तविक aquaculture प्रोजेक्ट की योजना बना रहे हैं? इस गणना को FishMatch RFQ की शुरुआत बनाइए। हर request पहले human review से गुजरती है, उसके बाद ही manufacturers से संपर्क होता है।
इस गणना को RFQ में बदलें