Feeding Planning and Feed Conversion: How to Improve FCR and Farm Economics by Species, Stage and System
Updated: 2026-10-13 · FishMatch Group
Short answer
FCR improves when the amount of feed matches what the stock can actually eat and convert: that requires a reliable biomass estimate, a ration adjusted to species, life stage, temperature and system, daily observation of feeding response, and good feed storage. Calculate FCR from your own feed logs and harvest weights, compare cohorts on the same basis, and judge changes by cost per kilogram of saleable harvest — not by FCR alone. There is no universal 'good' FCR: it depends on species, size, feed and system.
What FCR measures — and what it hides
Feed conversion ratio (FCR) is the feed delivered divided by the biomass gained. It mixes several things: feed eaten versus wasted, how well the animals convert what they eat, and how many animals survive to harvest. Two farms with the same FCR can have very different costs if their survival, harvest size or feed price differ. Always calculate it from the same data: total feed delivered for a cohort and the difference between harvest and stocked biomass.
Step 1 — Know the biomass you are feeding
Every ration is a percentage of an estimated biomass. Sample regularly with a consistent method (number of animals, location, time of day), record average weight and the size spread, and update the survival estimate. Errors here pass straight into over- or under-feeding. The biomass calculator helps keep the arithmetic consistent.
Step 2 — Adjust the ration to species, stage and system
- Species and stage: young stock need smaller particles, more frequent meals and different nutrient levels than grow-out stock. Follow the feed manufacturer's tables for that species and size as a starting point.
- Temperature: appetite and digestion change with water temperature; reduce feeding when the stock eats less.
- System: ponds may provide some natural food; RAS and tanks depend fully on the feed and on the treatment system's capacity to remove waste. In RAS the feed load also sets oxygen and biofilter demand.
- Oxygen: avoid heavy meals when oxygen is low; feeding increases oxygen demand.
Step 3 — Watch the feeding response
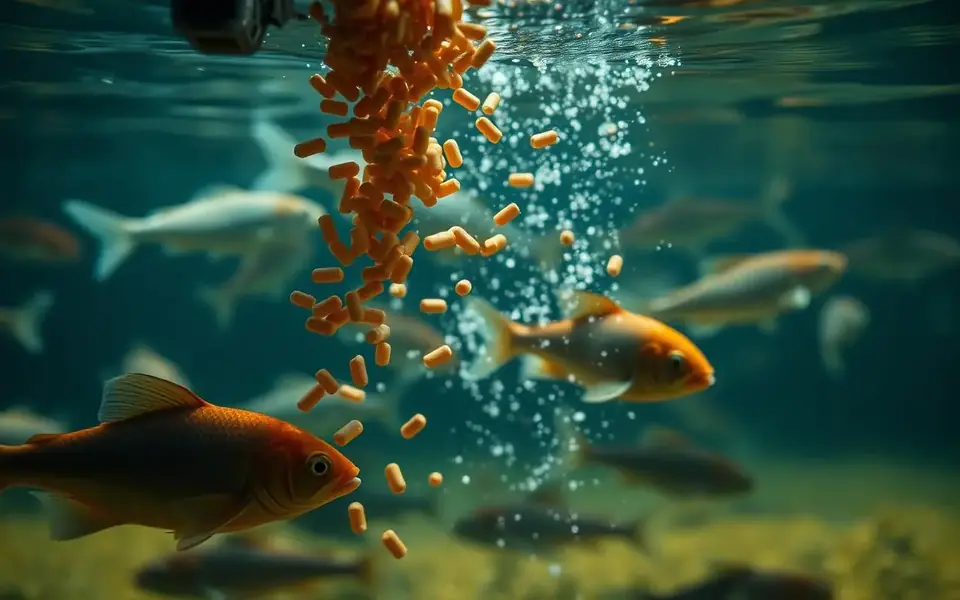
In ponds, feed trays show how much shrimp actually ate; in tanks, uneaten pellets and appetite are visible after each meal. Record leftovers and adjust the next meal. A drop in appetite is also an early warning of water-quality or health problems.
Step 4 — Protect feed quality
Store feed dry, cool, off the floor and away from pests, use the oldest batch first, and record batch numbers. Poor storage reduces nutritional value and can create mould or rancidity.
Step 5 — Calculate FCR and cost per kg the same way every cycle
| Input | Source |
|---|---|
| Feed delivered (kg) | Daily feed log per tank/pond |
| Stocked biomass (kg) | Count × average weight at stocking |
| Harvest biomass (kg) | Weighed harvest, saleable fraction separated |
| Feed price per kg | Invoices |
| Energy, labour, seed | Farm accounts |
Use the FCR calculator and the feed budget calculator to compare scenarios. Feed is often the largest operating cost, but survival and saleable harvest size usually move cost per kg as much as FCR does.
Step 6 — Test changes with a fair trial
When comparing feeds or feeding methods, run them in comparable units at the same time, with the same stocking and measurements, and evaluate FCR, growth, survival and cost per kg together. Ask feed suppliers for written specifications and their own trial conditions. Certification schemes such as ASC and BAP also set feed traceability requirements.
When feeding is not the bottleneck
If oxygen, water treatment or temperature control limit appetite, better feed will not fix the problem. Describe the system limits in a project intake; FishMatch reviews it and contacts suitable equipment suppliers for you.
Frequently asked questions
What is a good FCR for fish or shrimp?
There is no universal figure. FCR depends on species, size at harvest, feed, temperature, system and survival. Compare your own cohorts calculated the same way, and use feed-manufacturer data only as a reference.
How do I calculate FCR?
Divide the total feed delivered to a cohort by the biomass gained (harvest biomass minus stocked biomass). Use weighed harvests and the full feed log.
Does lower FCR always mean lower cost?
Not always. A cheaper feed with a higher FCR, or better survival and bigger harvest size, can give a lower cost per kilogram. Judge decisions by cost per kg of saleable harvest.
How often should rations be adjusted?
Whenever biomass estimates, temperature or feeding response change. Many farms adjust after each sampling and correct daily from leftovers or feed trays.
Can feeding affect water quality?
Yes. Uneaten feed and waste increase ammonia, solids and oxygen demand. In RAS, the daily feed load sets biofilter and oxygen requirements.
Tools and next steps
Sources
General guidance only. Targets, health decisions and results depend on species, region and system; consult qualified local professionals.