How to Improve Shrimp Survival, Growth and Harvest Results
Start with reliable stocking, feed, water-quality and harvest records. Identify the largest source of loss, test one manageable change against a recorded baseline, and compare survival, growth, biomass, FCR and variable cost per kg together. Results depend on species, life stage, climate and farming system; no improvement is guaranteed.
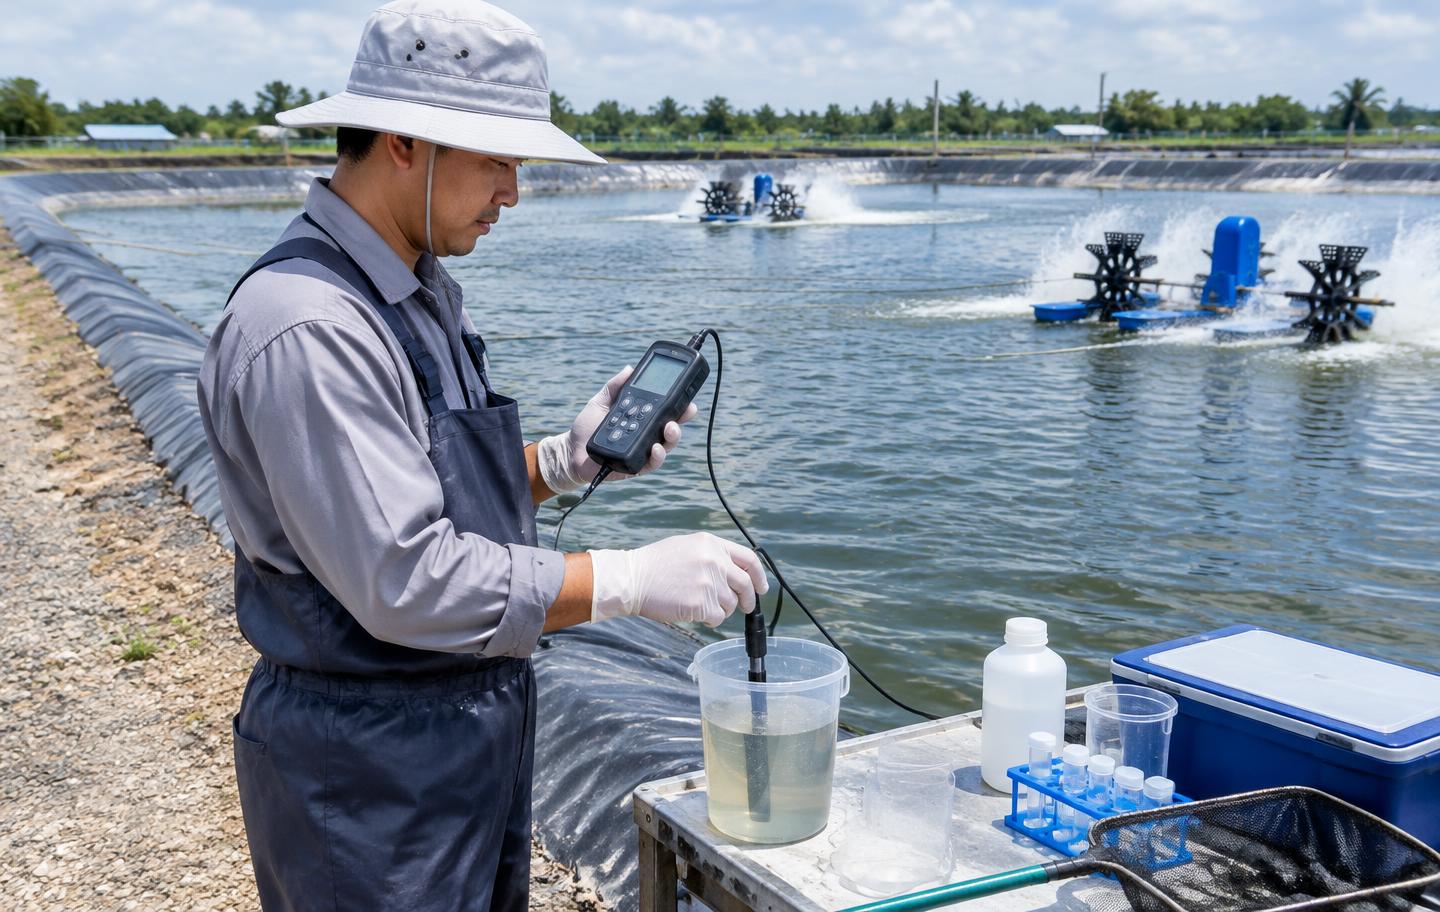
Original AI-generated illustrations of monitoring and sampling, not evidence from a specific farm.
Survival, biomass and variable-cost scenarios
Enter your own cycle assumptions. No biological targets or market prices are prefilled. Both columns are independent; use the same currency and cost boundary.
Enter all values as non-negative numbers; survival must be 0–100%, stocking count must be a positive whole number. FCR needs positive net biomass gain; cost/kg needs positive harvest biomass.
Baseline
- Estimated survivors
- —
- Harvest biomass (kg)
- —
- Net biomass gain (kg)
- —
- Apparent FCR (kg/kg)
- —
- Feed expense
- —
- Included variable costs
- —
- Variable cost / harvest kg
- —
Alternative
- Estimated survivors
- —
- Harvest biomass (kg)
- —
- Net biomass gain (kg)
- —
- Apparent FCR (kg/kg)
- —
- Feed expense
- —
- Included variable costs
- —
- Variable cost / harvest kg
- —
One closed cohort, one final harvest, no transfers or partial harvests. Net biomass gain subtracts the total stocked biomass. Survival and weights are your estimates; survivors may be fractional. Feed means offered feed. Other costs exclude feed. Variable cost excludes fixed overhead, finance, depreciation and omitted costs; it is not saleable cost or profit.
Formulas and units
- Survivors = stocked count × survival / 100
- Harvest kg = survivors × harvest g / 1,000
- Stocked kg = stocked count × stocking g / 1,000
- Net gain kg = harvest kg − stocked kg
- Apparent FCR = feed kg / positive net gain kg
- Feed expense = feed kg × feed price/kg
- Variable costs = feed expense + other variable costs
- Variable cost/kg = variable costs / positive harvest kg
How do you establish a useful baseline?
Define one cohort and one production boundary: stocking date, species, life stage, source batch, pond or tank, culture area or volume and harvest dates. Reconcile delivered animals with actual stocking, transfers, counted mortality and partial harvests. A supplier invoice is not proof of the number successfully stocked.
Keep a daily log of feed offered, mortalities observed, water measurements, weather, power interruptions, handling and interventions. Note the instrument, sampling point and time. Compare the same season and stocking stage where possible; ponds with different seed batches, salinity or aeration are not equivalent controls. FAO’s record-keeping guidance explains why written observations are more useful than memory.
FAO — Feed and feeding of fish and shrimp: record keepingHow are survival, growth, biomass and FCR measured?
Survival (%) = animals harvested ÷ animals stocked × 100, after reconciling transfers and partial harvests. During grow-out, survival is an estimate: a sample of animals captured cannot establish the total alive in the pond. Label assumptions and replace estimates with reconciled harvest records when available.
Average daily weight gain (g/day) = (current mean weight − previous mean weight) ÷ elapsed days. Use representative samples, the same weighing procedure and a recorded sample count. Track weight spread as well as the mean: large animals caught near a feeder may not represent the cohort.
Harvest biomass (kg) = harvested count × average harvest weight (g) ÷ 1,000. Biological FCR = feed offered (kg) ÷ net biomass gain (kg). The calculator below uses estimated surviving biomass minus total stocked biomass, assuming one closed cohort, no transfers and no partial harvests. Mortality and initial biomass affect this ratio. Where harvested count is uncertain or natural food contributes, treat it as apparent FCR, not a laboratory digestibility measure.
FAO — Feed and feeding of fish and shrimp: record keepingWhich water-quality observations help explain losses?
Monitor dissolved oxygen, temperature, salinity where relevant, pH and nitrogen compounds under a farm-specific plan. Record oxygen during periods likely to expose the lowest availability as well as after feeding or an outage. A single afternoon reading can hide a daily swing. Check sensor calibration and sample more than one depth or location when the pond is not uniform.
Interpret ammonia alongside pH and temperature, not in isolation. Rain, evaporation, algal changes, excess organic material and equipment failures can alter conditions. Water exchange is not automatically the safest response: source-water quality, pathogen pathways, permits and effluent capacity must be reviewed. FAO’s shrimp water-quality chapter describes these relationships for its historical culture context; its numerical ranges are not universal operating targets.
FAO — Shrimp culture: water-quality managementHow should stocking density fit the system?
Choose density from the life-support capacity, management resources and species-specific evidence, not from a competitor’s harvest claim. A density in animals/m² cannot be transferred directly to a tank expressed in kg/m³. Peak biomass and peak feed load matter more than the initial count alone.
Review aeration, circulation, solids handling, water supply, discharge arrangements, power backup and the operator’s response capacity before increasing stocking. Compare density changes against stress, feed access, size variability and cost; producing more kilograms does not automatically lower cost per kilogram. Shrimp ponds, biofloc, fish cages and RAS have different constraints.
FAO — Shrimp culture: water-quality managementWhat should be documented during stocking and acclimation?
Record transport duration, batch identity, condition on arrival and measured water conditions in both the transport container and receiving unit. Plan handling and acclimation with the hatchery and a qualified local aquatic-health professional for the actual species and stage. Do not copy a fixed acclimation duration from an unrelated climate or stock source.
FAO’s grow-out chapter describes losses associated with handling, transport and initial stocking. Separate these early losses from later grow-out mortality in your log. For fish, adapt the same documentation principle to fingerlings and their transport conditions; shrimp post-larval procedures are not automatically appropriate for fish.
FAO — Shrimp culture: grow-out proceduresHow can sampling and feeding decisions be made more reliable?
Record feed by date, batch, pellet size, unit and quantity offered. Use representative weighing and feeding observations to update the estimated biomass; do not adjust the ration only because the previous day’s tray looked empty. Uneaten feed, appetite, water conditions, animal distribution and recent handling should be considered together.
FAO recommends farm records that connect growth, feed and production outcomes. Feed trays help observe shrimp feeding, but tray consumption is not a census or a stand-alone survival measure. Fish may require different feeding observation methods and pellet sizes. Confirm storage condition and shelf-life guidance; distinguish feed delivered to the farm from feed actually offered to the cohort.
FAO — Feed and feeding of fish and shrimp: record keeping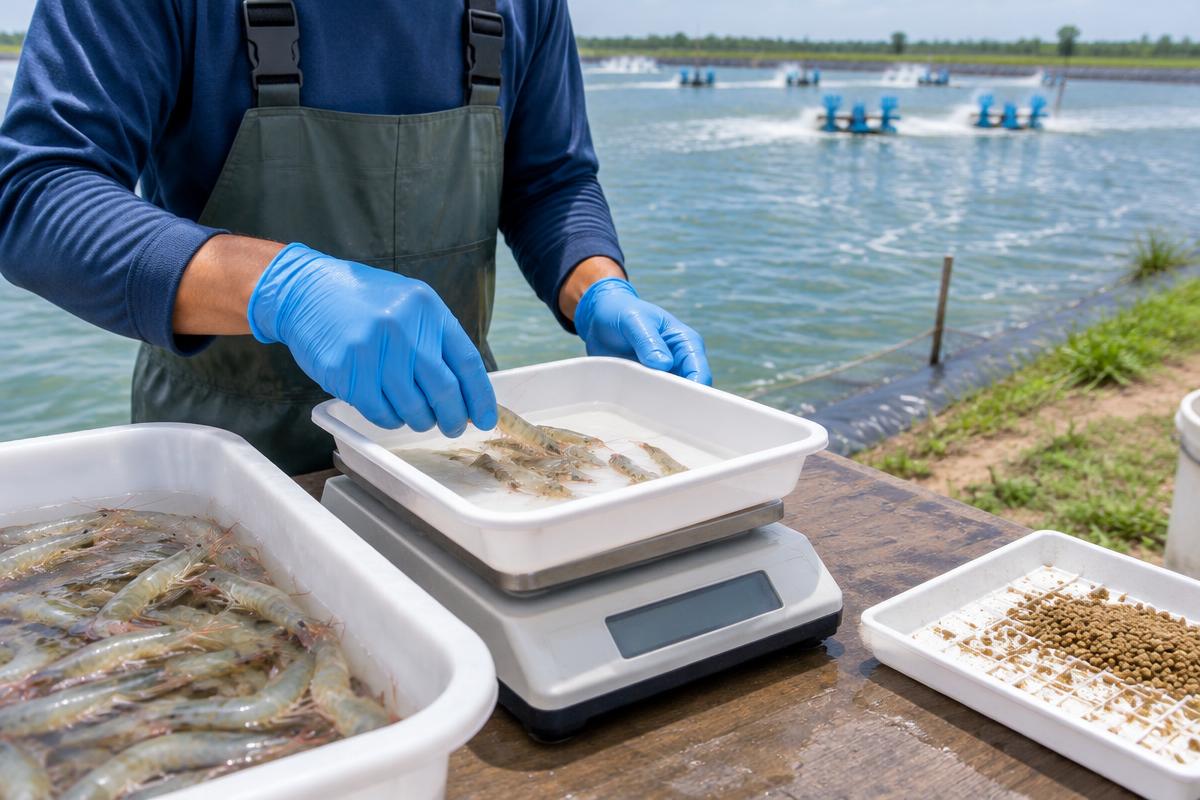
What biosecurity checks and warning signs deserve attention?
Map pathways for incoming stock, water, staff, visitors, vehicles, shared tools and movement between units. Keep batch records and define clean/dirty workflows, dedicated equipment where appropriate, and a locally reviewed health-monitoring plan. Separate life stages or cohorts where the production design supports it. Prevention measures must suit the site rather than become an unsupported certification claim.
A sudden decline in feed consumption, unusual swimming or congregation, abnormal appearance, or unexpected mortality warrants prompt measurement and professional review. Check water and equipment status and follow the farm’s established contingency protocol. These signs have multiple possible causes: this guide does not diagnose disease, recommend medicines or replace a veterinarian or competent aquatic-health authority.
FAO — Disease prevention and health managementHow do you test one change without confusing the result?
Write a question before the trial, such as whether a revised feeding observation schedule changes feed use at comparable growth. Record the baseline period, chosen change, eligible unit, sampling method, review dates and safety stop criteria. Keep other controllable factors unchanged; record unavoidable changes in weather, stock, labour, water or equipment.
Compare a similar untreated unit when practical, or repeat the observation in another comparable cycle. A before/after result can be influenced by season and animal age, so it is not proof of causation. Never delay an urgent welfare response to preserve an experiment. Review survival, growth, size distribution, biomass, FCR and variable cost together, including the extra labour or equipment cost.
Keep a simple trial sheet: date and unit; baseline observation; change and reason; feed and water records; weight sample and sample count; mortality/transfer notes; costs; conclusion and next check. This method is FishMatch Group’s management synthesis, not an FAO-guaranteed protocol.
FAO — Feed and feeding of fish and shrimp: record keepingWhat does variable cost per kilogram include—and exclude?
Use one currency and one cycle boundary. Feed expense = feed offered × feed price per kg. Add the variable costs you actually include, such as seed, energy, direct harvest labour, consumables and disposal. Do not count feed again inside other variable costs. Estimated variable cost/kg = included cycle variable costs ÷ estimated harvest biomass.
This is not full production cost, profit or a financing appraisal. It excludes fixed overhead, depreciation, finance, taxes and any omitted cost. Harvest biomass is not necessarily saleable biomass: grading rejects, processing losses and mortality during harvest can reduce saleable weight. For a saleable-cost assessment, reconcile actual saleable kilograms separately. Local feed and energy quotations are required; the calculator does not supply market prices.
FAO — Feed and feeding of fish and shrimp: record keepingHow do species, climate and system change the plan?
For shrimp, record species and post-larval source, salinity regime, moulting and feeding observations, pond condition and harvest method. For farmed fish, record species, fingerling size, grading, handling and the relevant oxygen and temperature requirements. Translate the recording method, not a shrimp biological target, to fish.
Warm-season oxygen demand, cold-weather feeding, rainfall and evaporation can change the interpretation. RAS adds biofilter, flow and alarm dependencies; biofloc adds solids and microbial-process demands; ponds depend on weather and water distribution; cages depend on external water and site exposure. Ask a qualified professional to review thresholds and emergency actions for the local setting.
FAO — Shrimp culture: water-quality managementHow do harvest records close the improvement loop?
Plan harvest around animal welfare, measured water conditions, access, handling capacity and the intended market. Reconcile counted or weighed batches, mean size, partial harvests, rejects and saleable weight. Compare actual records with the estimates used during the cycle; investigate discrepancies before treating the next production target as established.
If the main constraint is equipment or life-support capacity, define the species, system, scale, site conditions and production goals first. Then prepare a structured RFQ and compare suitable options with the FishMatch project team. Commercial managed requests start at USD 250,000. Supplier identities and contact details remain private; no production result or supplier availability is promised.
FAO — Shrimp culture: grow-out proceduresProfessional sources and scope
- FAO — Shrimp culture: water-quality management
- FAO — Shrimp culture: grow-out procedures
- FAO — Feed and feeding of fish and shrimp: record keeping
- FAO — Disease prevention and health management
These FAO manuals explain management principles in their original species and production context. They are not current local regulations, universal thresholds or endorsements of FishMatch Group. Obtain current local health, welfare and environmental advice. The scenario formulas and trial checklist are explained here so their assumptions can be reviewed.
Questions about shrimp and fish farm results
Continue with your project measurements
Define the project before choosing equipment
Use the free scenario tool first. If a commercial upgrade is needed, record your species, production system, capacity and site needs. FishMatch prepares a reviewed RFQ and coordinates comparison of suitable options; no direct buyer-to-provider handoff.
Optional project RFQ